Fig. 2.
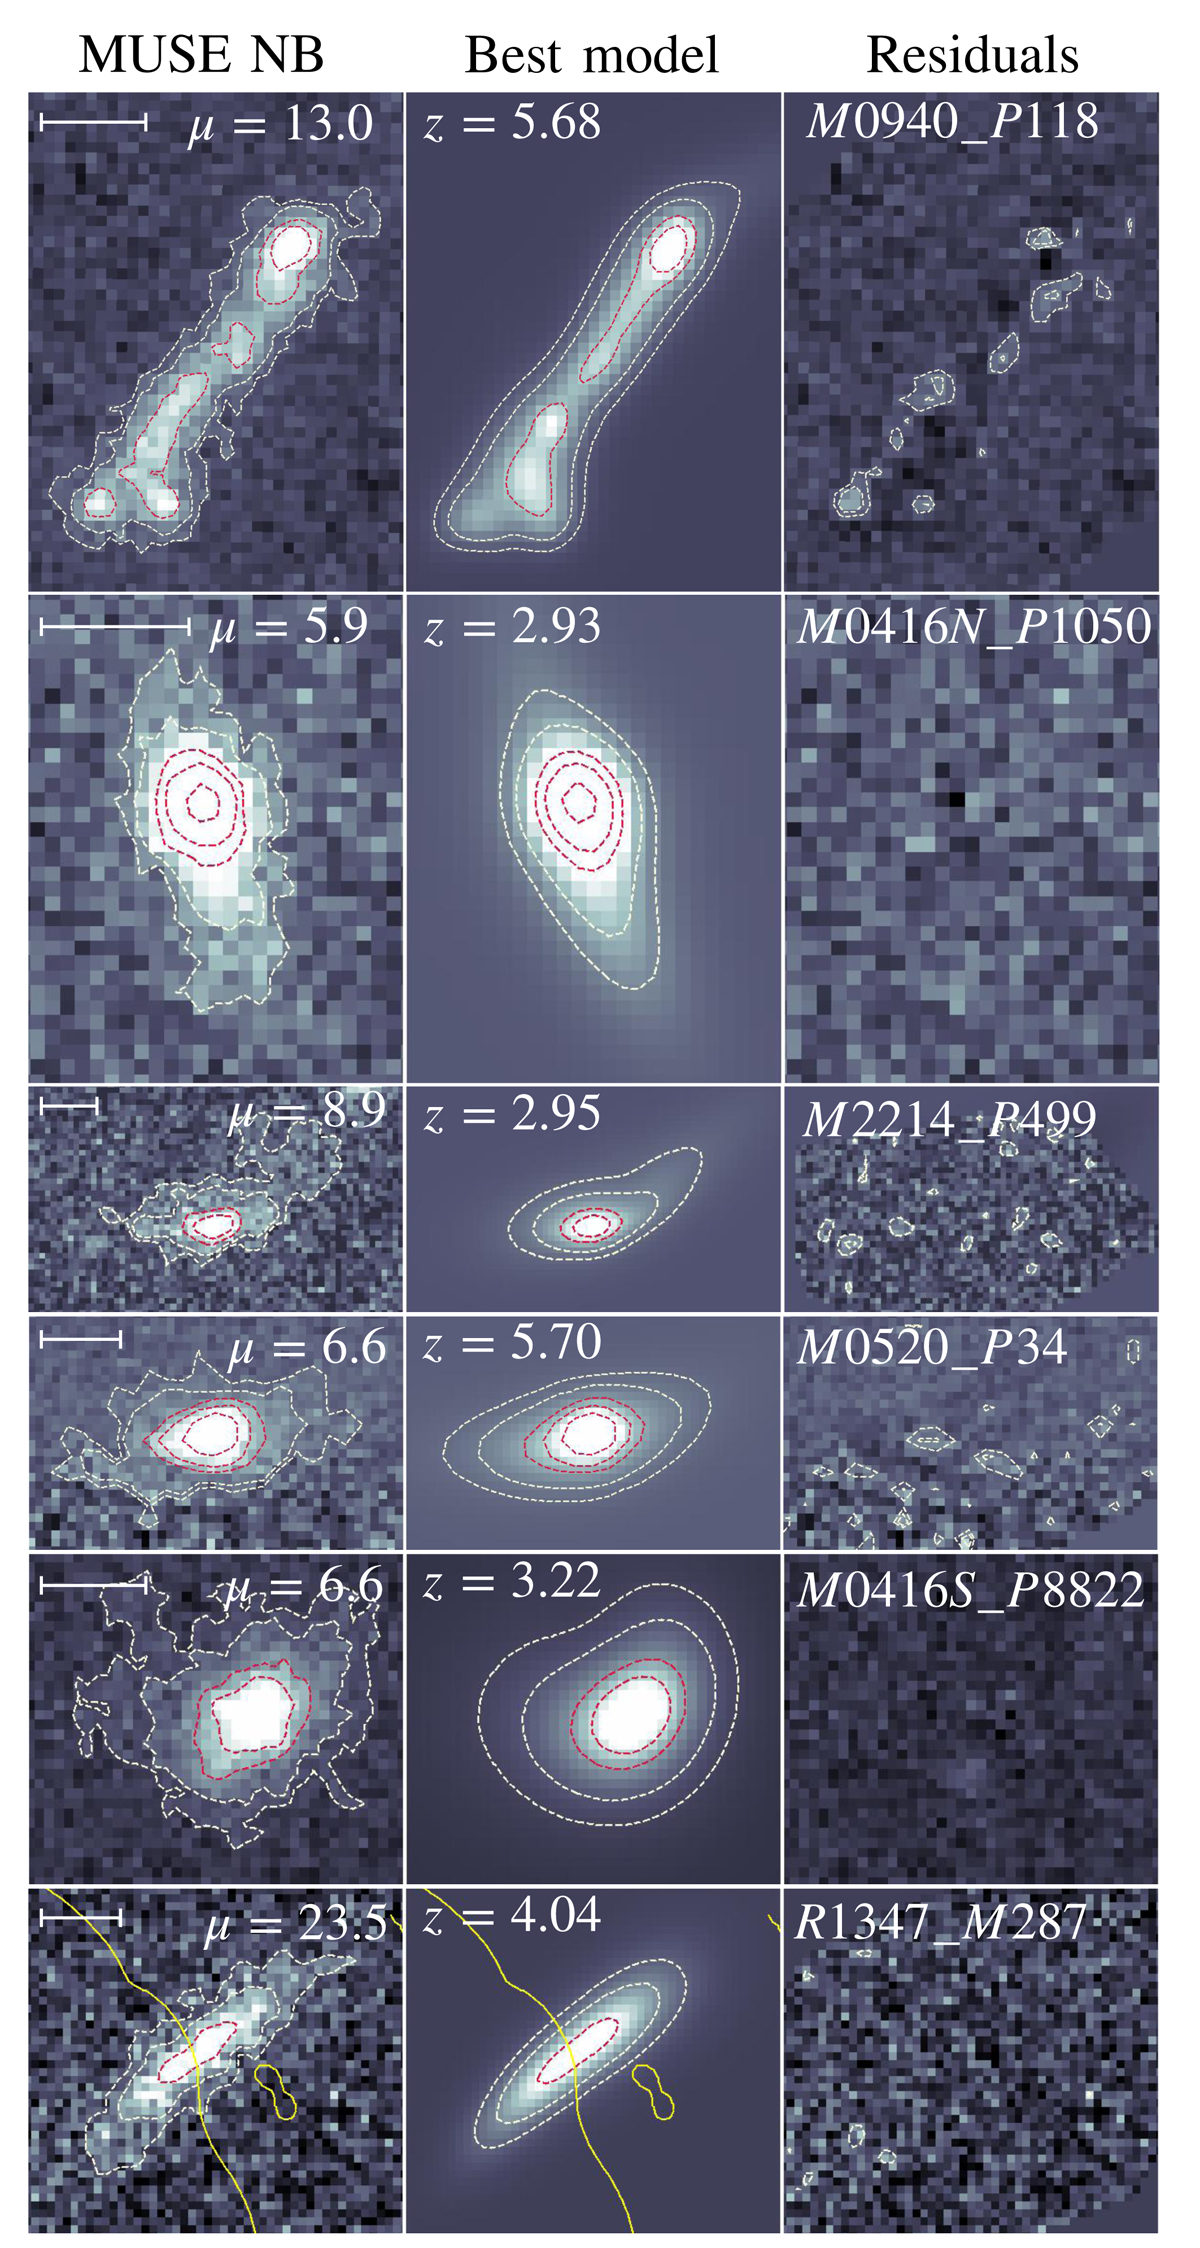
Download original image
Examples of LLAMAS galaxies and the best spatial models. In each row, we show, from left to right, the MUSE NB image, the best model and residuals. The contours present smoothed surface brightness levels at 12.5 and 25.0 × 10⁻¹⁹ erg s−1 cm−2 arcsec−2 in light yellow and at 62.5, 100 and 200 × 10−19 erg s−1 cm−2 arcsec−2 in red. The scale in the left panels are all at 2 arcsec. We indicate from left to right the magnification value (μ), the redshift, and ID of the source. In the last column, the areas without pixels indicates the edges of the area located in the region where the fit is applied, when any area without pixels is visible, it means that the region used is larger than the image presented in the figure. In the last row, the yellow line represent the critical line.
Current usage metrics show cumulative count of Article Views (full-text article views including HTML views, PDF and ePub downloads, according to the available data) and Abstracts Views on Vision4Press platform.
Data correspond to usage on the plateform after 2015. The current usage metrics is available 48-96 hours after online publication and is updated daily on week days.
Initial download of the metrics may take a while.