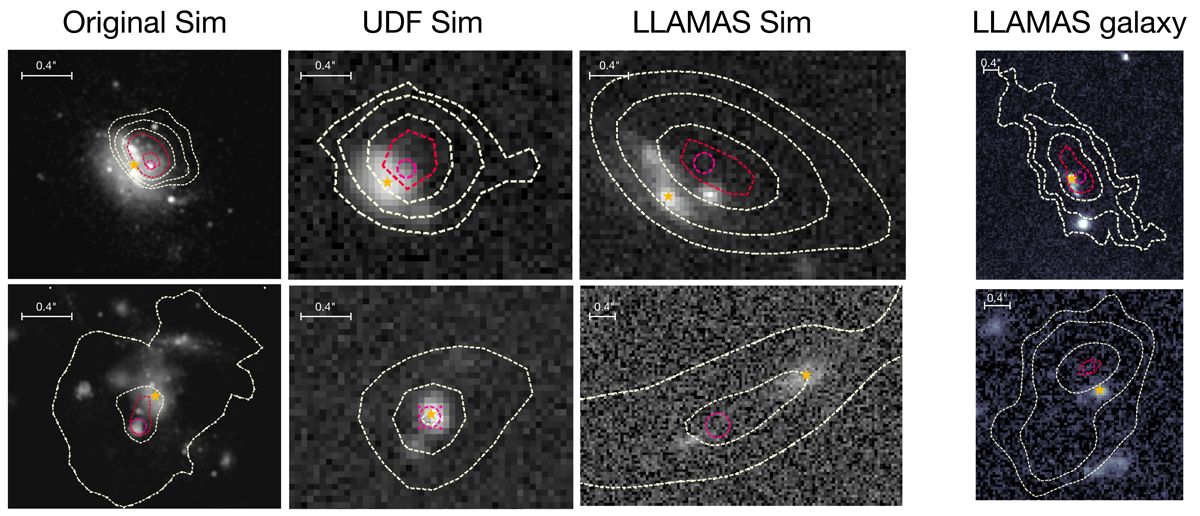
Fig. 17.
Download original image
Two examples of simulated galaxies. From left to right: high-resolution image (UV emission), simulated HST image, simulated HST image of the same galaxy lensed by a LLAMAS cluster, and HST image of a real LLAMAS galaxy. In each image, the contours represent the Lyman-α emission. The orange stars show the location of the centroid of the UV emission and the pink circle the location of the Lyman-α centroid. The first row presents an example of spatial offset produced by an offsetted UV bright clump. The second row presents an example of a spatial offset produced by a faint UV component spatially coincident with a strong Lyman-α emission peak.
Current usage metrics show cumulative count of Article Views (full-text article views including HTML views, PDF and ePub downloads, according to the available data) and Abstracts Views on Vision4Press platform.
Data correspond to usage on the plateform after 2015. The current usage metrics is available 48-96 hours after online publication and is updated daily on week days.
Initial download of the metrics may take a while.