Fig. 16.
Download original image
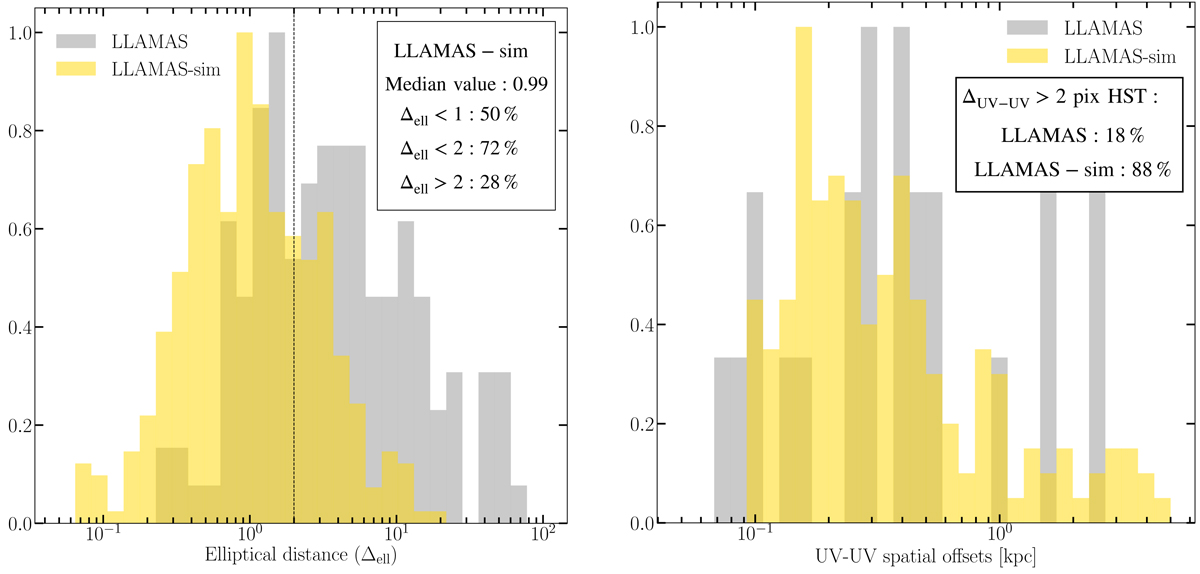
Spatial offsets measured in the simulated galaxies. Left: distribution of elliptical distance measured in the source plane between the Lyman-α emission centroids and the ellipse formed by the UV emission distribution (using r90,UV as radius) for the LLAMAS galaxies (in grey) and the simulated LLAMAS galaxies (in yellow). Right: distribution of the UV-UV spatial offsets measured between the UV emission peak and the UV centroid position in LLAMAS galaxies (in grey) and simulated LLAMAS galaxies in yellow. We show here only the galaxies for which this UV-UV offset is higher than 2 HST pixels in the image plane.
Current usage metrics show cumulative count of Article Views (full-text article views including HTML views, PDF and ePub downloads, according to the available data) and Abstracts Views on Vision4Press platform.
Data correspond to usage on the plateform after 2015. The current usage metrics is available 48-96 hours after online publication and is updated daily on week days.
Initial download of the metrics may take a while.