Fig. 15.
Download original image
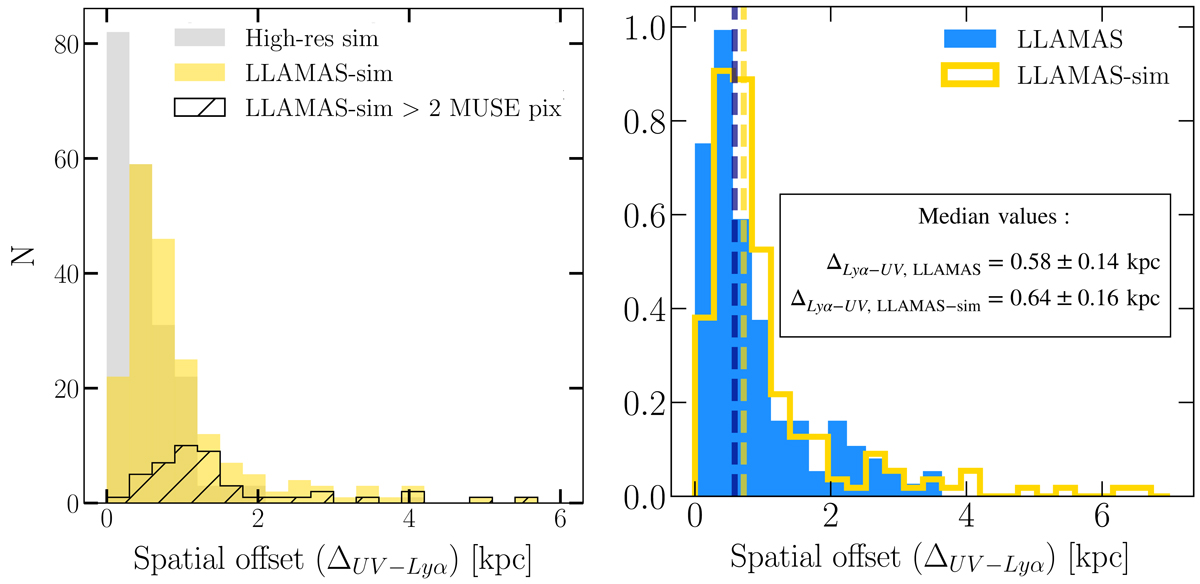
Spatial offset distributions. Left: distribution of the spatial offsets measured in the simulated raw data (grey), simulated lensed observations (yellow). The black distribution show the spatial offsets which are observed in the image plane higher than 2 MUSE pixels. Right: normalized spatial offset distribution for the LLAMAS galaxies (in blue) and the LLAMAS simulated galaxies (in yellow). The dashed lines show the mean value of the two samples.
Current usage metrics show cumulative count of Article Views (full-text article views including HTML views, PDF and ePub downloads, according to the available data) and Abstracts Views on Vision4Press platform.
Data correspond to usage on the plateform after 2015. The current usage metrics is available 48-96 hours after online publication and is updated daily on week days.
Initial download of the metrics may take a while.