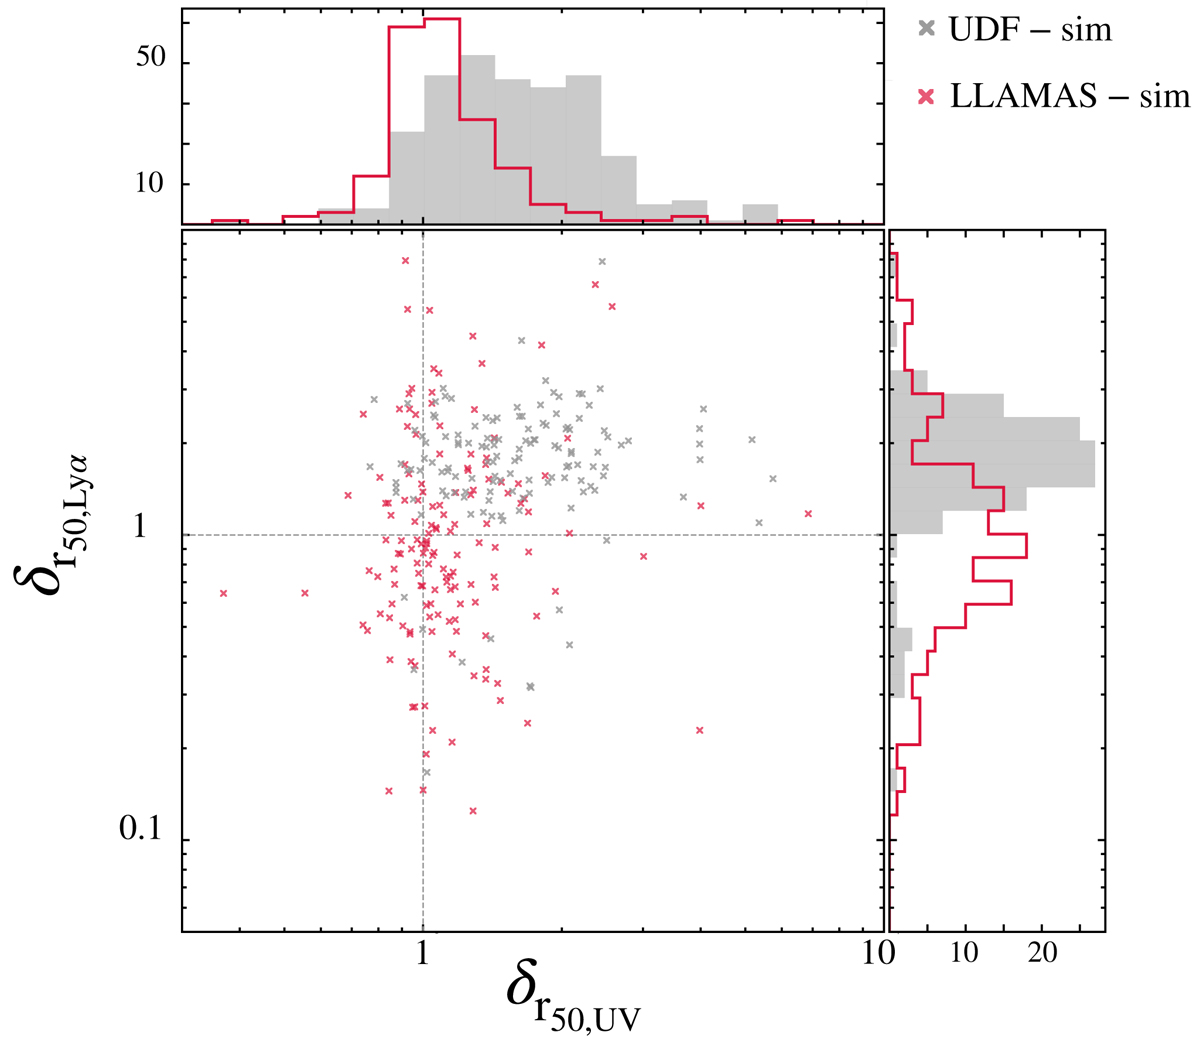
Fig. 14.
Download original image
Distribution of the ratio of the measurements of r50, Lyα and r50, UV for UDF simulated (in grey) and LLAMAS simulated (in red) galaxies to the same measurements done on raw simulated data. The middle panel shows the distribution of the points for the 2 samples and the top and right panel the distribution of each parameter. The grey lines indicate δ50, Lyα = 1, δ50, UV = 1.
Current usage metrics show cumulative count of Article Views (full-text article views including HTML views, PDF and ePub downloads, according to the available data) and Abstracts Views on Vision4Press platform.
Data correspond to usage on the plateform after 2015. The current usage metrics is available 48-96 hours after online publication and is updated daily on week days.
Initial download of the metrics may take a while.