Fig. 10.
Download original image
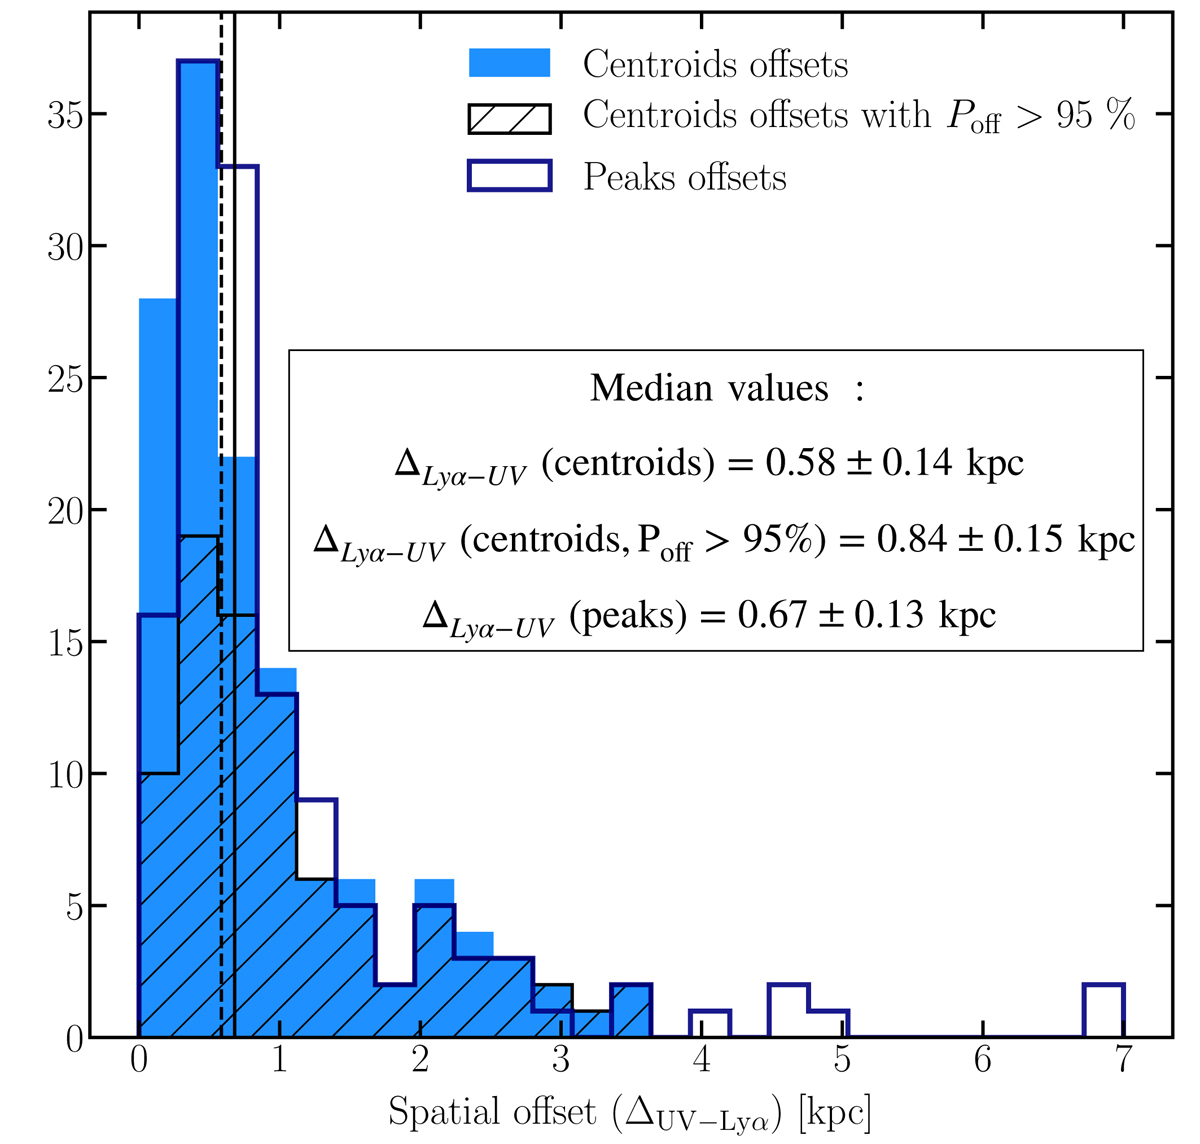
Distributions of measured offsets in kpc in the source plane. The light blue distribution represents spatial offsets measured between UV and Lyman-α emission centroids measured in the source plane, and the dark blue one the distribution of spatial offsets measured between UV and Lyman-α emission peaks projected in the source plane. The hatched distribution represents the galaxies with a spatial offset probability higher than 95%. The dashed and solid lines show the median values of centroid and peaks offset distributions, respectively.
Current usage metrics show cumulative count of Article Views (full-text article views including HTML views, PDF and ePub downloads, according to the available data) and Abstracts Views on Vision4Press platform.
Data correspond to usage on the plateform after 2015. The current usage metrics is available 48-96 hours after online publication and is updated daily on week days.
Initial download of the metrics may take a while.