Fig. 4
Download original image
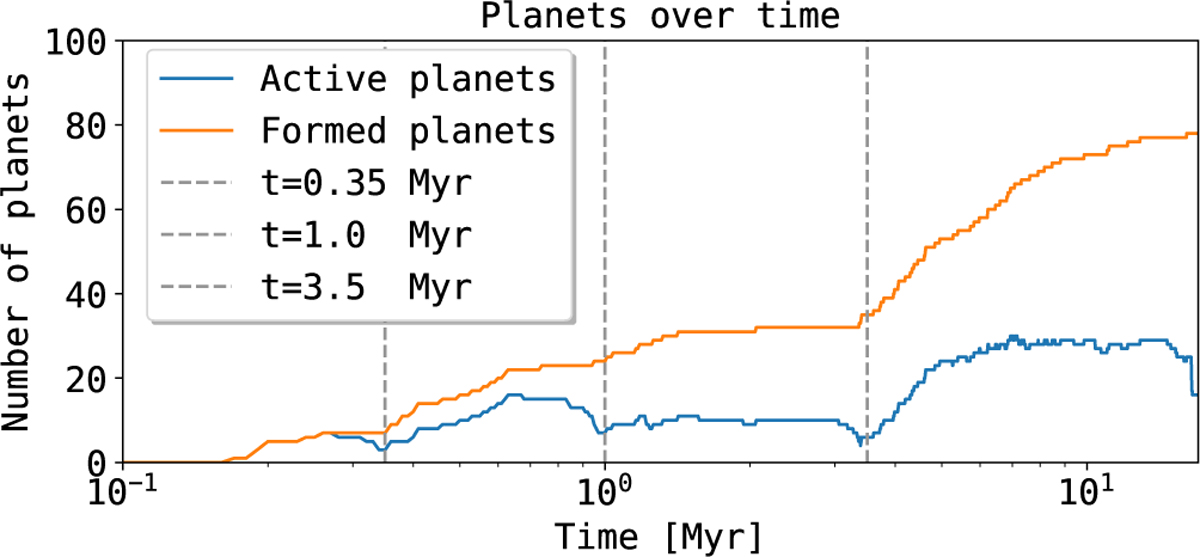
Number of planets over time. The blue line shows the number of currently active planets in the system, while the orange line shows the total number of planets that have formed. The vertical lines are drawn at 0.35 Myr, 1 Myr, and 3.5 Myr and show the moments at which most currently active planets are accreted by the host star or were subject to mergers.
Current usage metrics show cumulative count of Article Views (full-text article views including HTML views, PDF and ePub downloads, according to the available data) and Abstracts Views on Vision4Press platform.
Data correspond to usage on the plateform after 2015. The current usage metrics is available 48-96 hours after online publication and is updated daily on week days.
Initial download of the metrics may take a while.