Fig. 2
Download original image
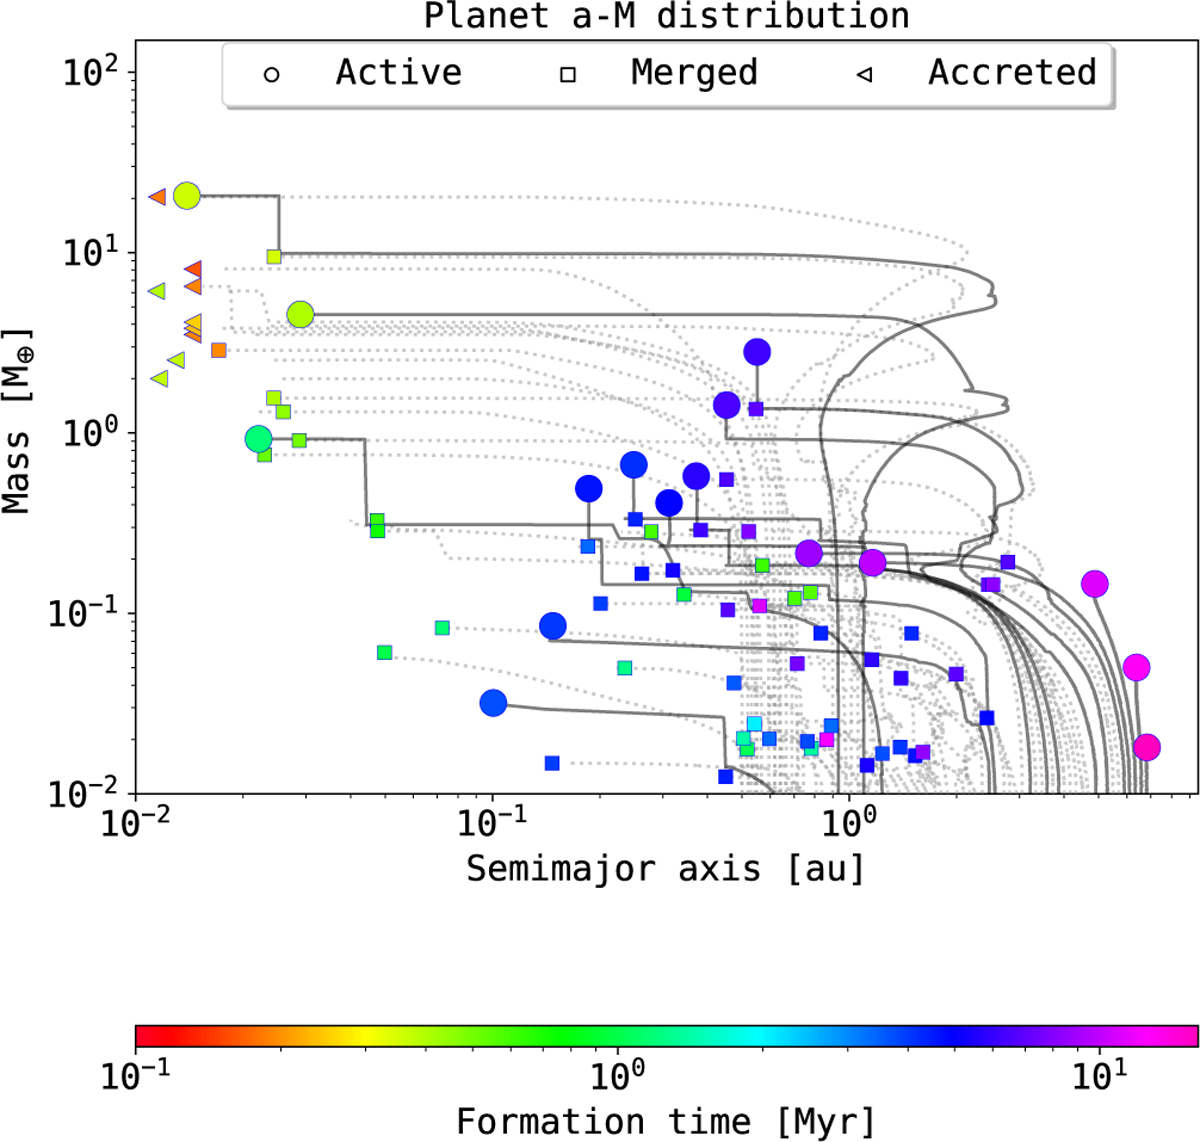
Mass and semimajor axis distribution of the entire planetary system until the dispersal of the gas disk. The large circle markers indicate planets that remain active until the end of the simulation. Planets that were accreted by the host star are shown as triangles and planets that merged via collisions with other planets are indicated as squares. The track of the planets is shown as the solid grey line for active planets and dotted grey lines for accreted or merged planets. The color of the final marker indicates the initial formation time of the corresponding planetary embryo.
Current usage metrics show cumulative count of Article Views (full-text article views including HTML views, PDF and ePub downloads, according to the available data) and Abstracts Views on Vision4Press platform.
Data correspond to usage on the plateform after 2015. The current usage metrics is available 48-96 hours after online publication and is updated daily on week days.
Initial download of the metrics may take a while.