Fig. 1
Download original image
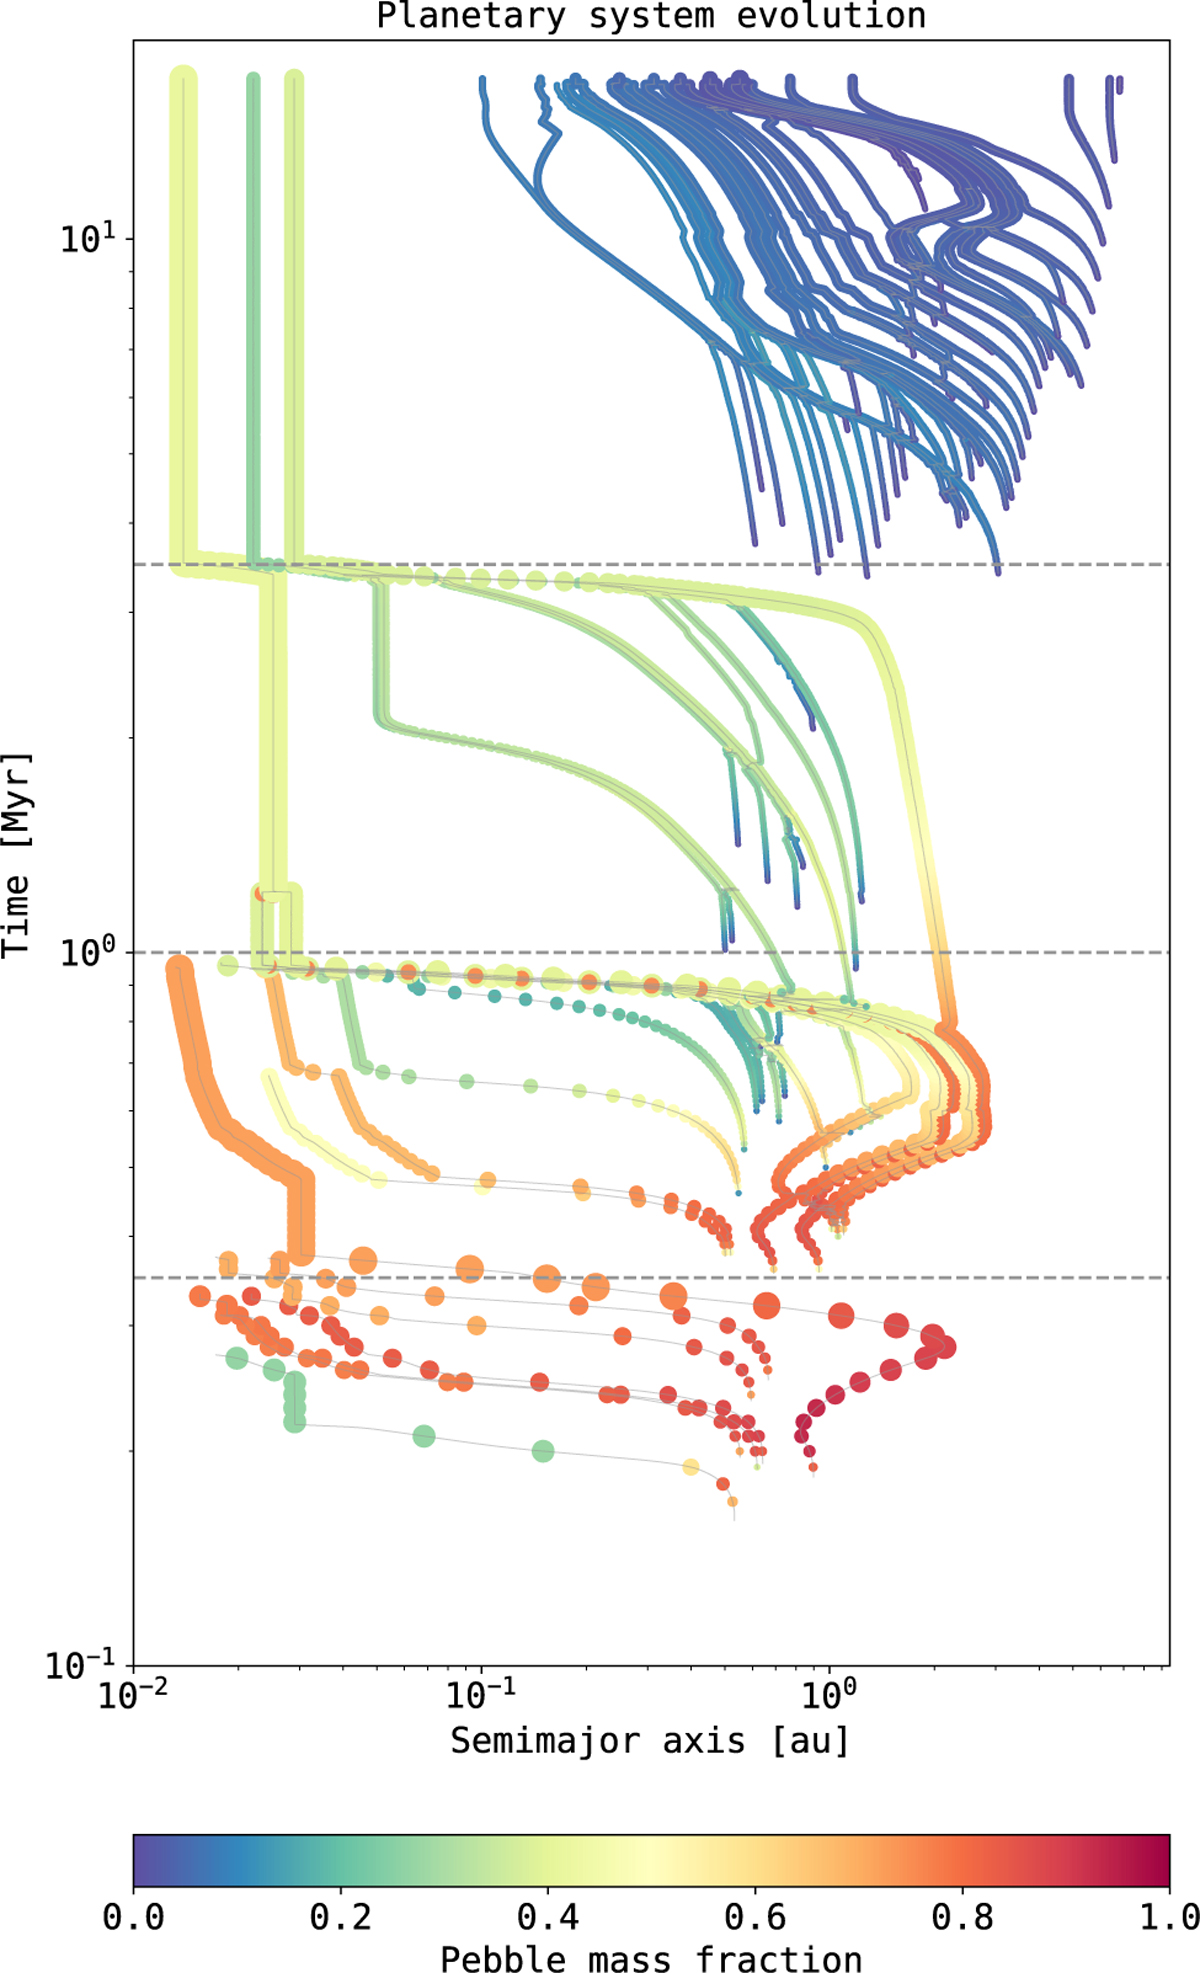
Semimajor axis over time evolution for the planetary system. The evolution of a planet is linked via the grey line and the size of the dots indicate the mass of the planets every 10 ky. The color of the planets indicates their pebble mass fraction Mpeb/MP. The horizontal lines are drawn at 0.35 Myr, 1 Myr, and 3.5 Myr and show the moments at which most currently active planets are accreted by the host star or were subject to mergers. Thus we find four distinct generations of planet formation.
Current usage metrics show cumulative count of Article Views (full-text article views including HTML views, PDF and ePub downloads, according to the available data) and Abstracts Views on Vision4Press platform.
Data correspond to usage on the plateform after 2015. The current usage metrics is available 48-96 hours after online publication and is updated daily on week days.
Initial download of the metrics may take a while.