Fig. 9
Download original image
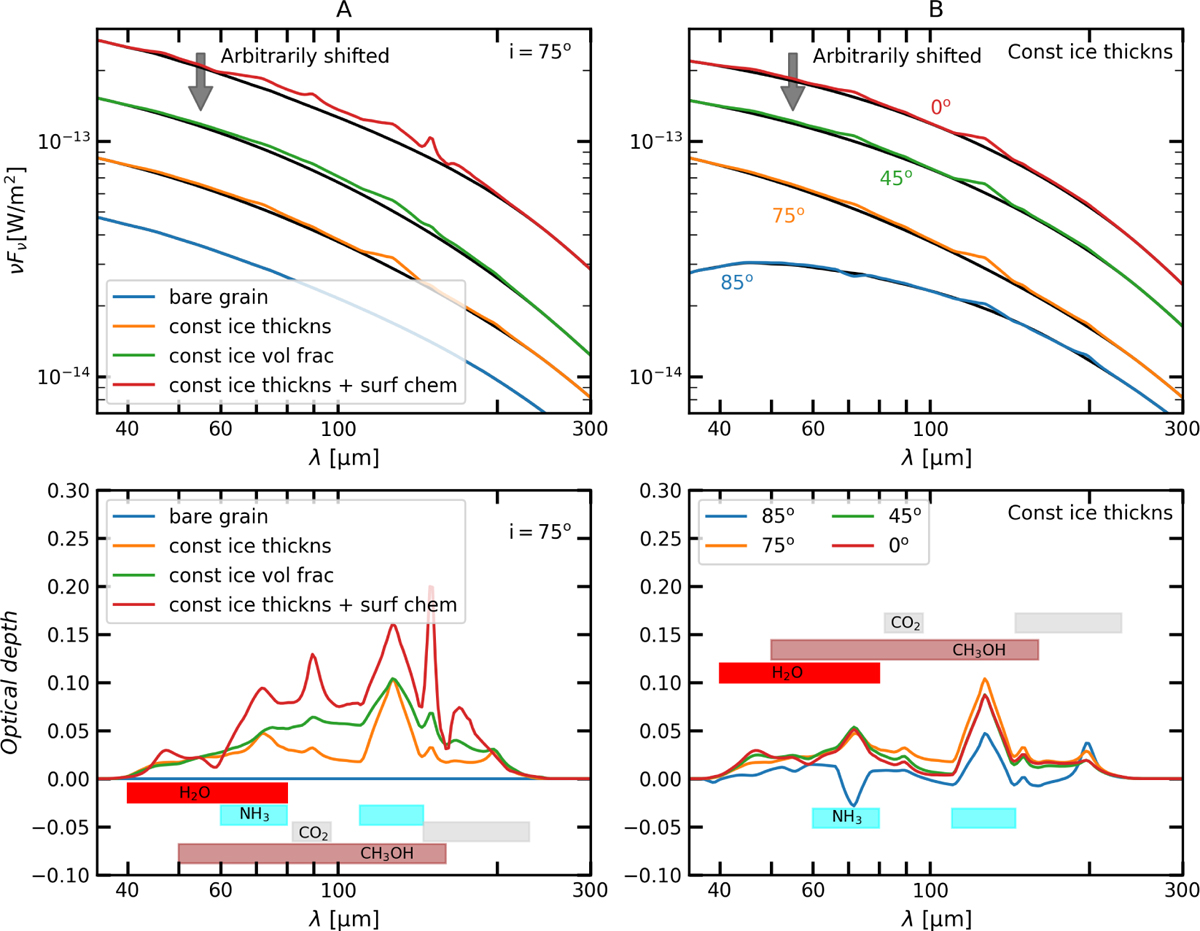
Spectral energy distributions and optical depths of ices in different models. The top panels show the spectral energy distributions of different models between 40 µm and 300 µm. The black curves indicate a pseudo-continuum used to obtain the optical depths of the ice features. In each panel, the SED of the different models are arbitrarily shifted to provide better visualization. The bottom panels show optical depths of the ice features in the SEDs in the top panels. Panel A shows the ice features in the four models at a disk inclination of 75°. Panel B shows the ice features for the model with constant ice thickness without grain surface chemistry at different disk inclinations. Note that the orange curve in each panel is the same model. The ice features are marked using colored rectangles in the optical depth plots.
Current usage metrics show cumulative count of Article Views (full-text article views including HTML views, PDF and ePub downloads, according to the available data) and Abstracts Views on Vision4Press platform.
Data correspond to usage on the plateform after 2015. The current usage metrics is available 48-96 hours after online publication and is updated daily on week days.
Initial download of the metrics may take a while.