Open Access
Fig. 11
Download original image
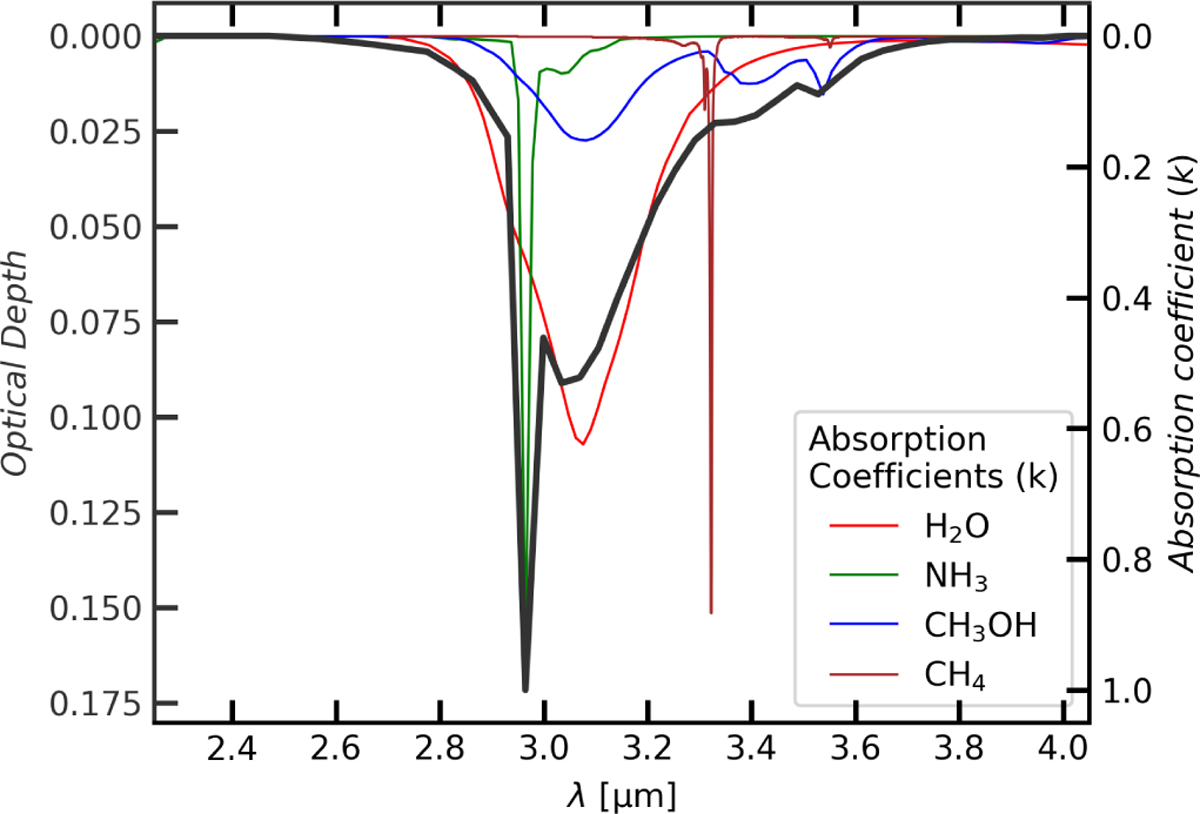
Optical depth of the 3 µm H2O ice feature derived from the spectral flux density obtained from model 2 in Fig. 10. The optical depth is shown in dark gray thick line and the absorption coefficients of ice species that have a feature in the plotted wavelength range are shown as colored thin lines.
Current usage metrics show cumulative count of Article Views (full-text article views including HTML views, PDF and ePub downloads, according to the available data) and Abstracts Views on Vision4Press platform.
Data correspond to usage on the plateform after 2015. The current usage metrics is available 48-96 hours after online publication and is updated daily on week days.
Initial download of the metrics may take a while.