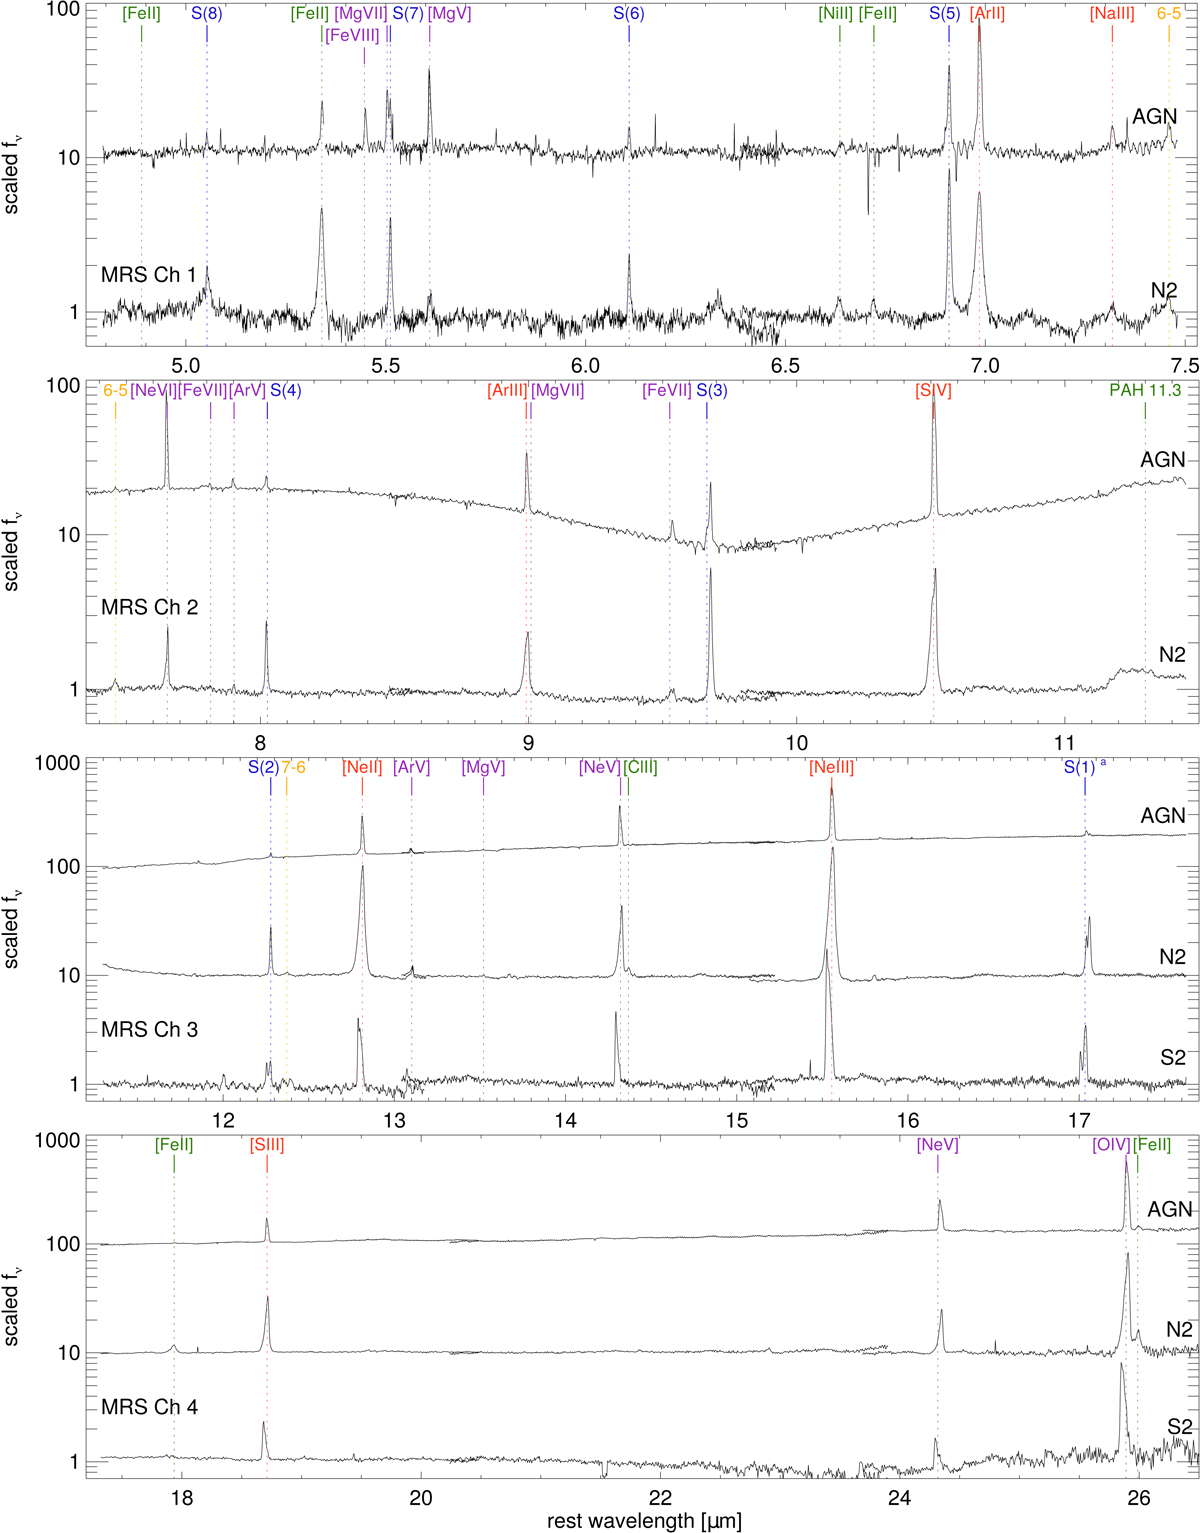
Fig. B.1.
Download original image
Continuum-subtracted MIRI/MRS spectra of three regions (AGN, N2, and S2) of NGC 7319 (see Figs. 1, 2, and 4) shown at rest wavelength (assuming z = 0.02251). The continuum level is determined from a linear fit to the flux at the edges of the covered spectral range in each channel. A point-source aperture correction is applied to the AGN spectra. From top to bottom, the panels show the spectra from MRS channels 1, 2, 3, and 4, respectively. Region S2 is not covered by the FoVs of channels 1 or 2. The wavelength of the emission lines are indicated in blue for rotational H2 transitions, in orange for H recombination lines, and in green, red, and purple for transitions from low-ionization (IP< 13.6 eV), intermediate-ionization (13.6 eV< IP< 54.4 eV), and high-ionization (IP> 54.4 eV) species, respectively. The continuum-subtracted spectra have been scaled and shifted for visualization purposes. In this figure we shifted the channel 3 medium sub-band wavelength by 0.04 μm to correct for a wavelength calibration artifact (see Appendix A.1). a The H2 S(1) 17.03 μm transition is affected by a wavelength calibration artifact that alters the line profile of the AGN and N2 spectra but not the observed line flux (see Appendix A.1).
Current usage metrics show cumulative count of Article Views (full-text article views including HTML views, PDF and ePub downloads, according to the available data) and Abstracts Views on Vision4Press platform.
Data correspond to usage on the plateform after 2015. The current usage metrics is available 48-96 hours after online publication and is updated daily on week days.
Initial download of the metrics may take a while.