Fig. 4.
Download original image
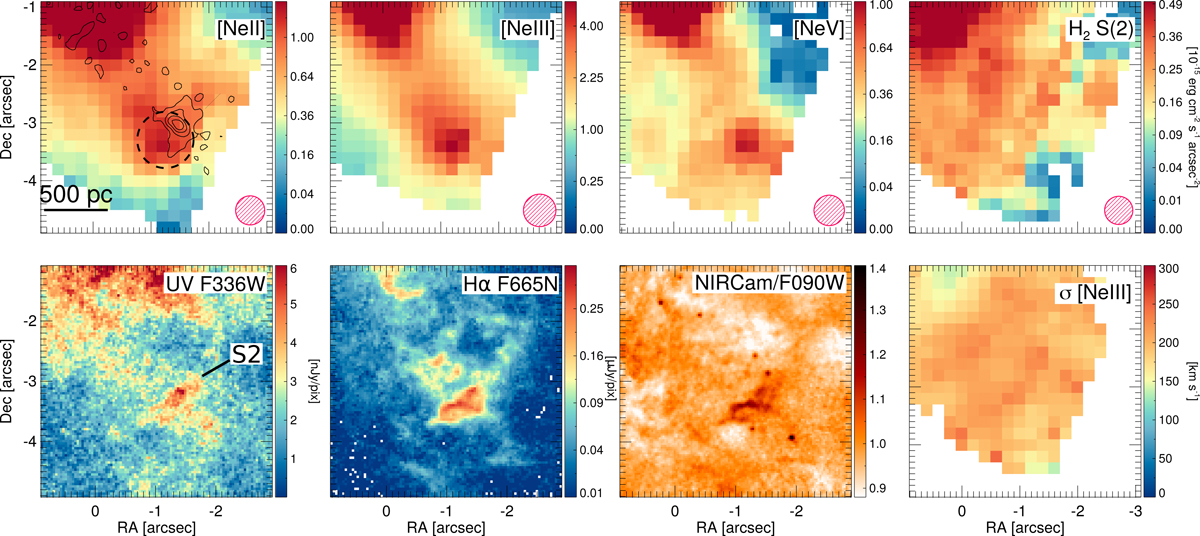
Southern radio lobe and hotspot S2 of NGC 7319. First row, from left to right: [Ne II]12.81 μm, [Ne III]15.56 μm, [Ne V]14.32 μm, and H2 S(2) 12.28 μm MIRI MRS line maps. The contours on the first panel represent the 1.4 GHz emission for reference, as in Fig. 1. The dashed circle on the [Ne II] map is the S2 extraction aperture. The red hatched circles represent the PSF FWHM, ∼0![]() 49–0
49–0![]() 56. Second row: The first three panels are the same as the last-row panels of Fig 2. The fourth panel is the velocity dispersion of the [Ne III]15.56 μm emission line.
56. Second row: The first three panels are the same as the last-row panels of Fig 2. The fourth panel is the velocity dispersion of the [Ne III]15.56 μm emission line.
Current usage metrics show cumulative count of Article Views (full-text article views including HTML views, PDF and ePub downloads, according to the available data) and Abstracts Views on Vision4Press platform.
Data correspond to usage on the plateform after 2015. The current usage metrics is available 48-96 hours after online publication and is updated daily on week days.
Initial download of the metrics may take a while.