Fig. 2.
Download original image
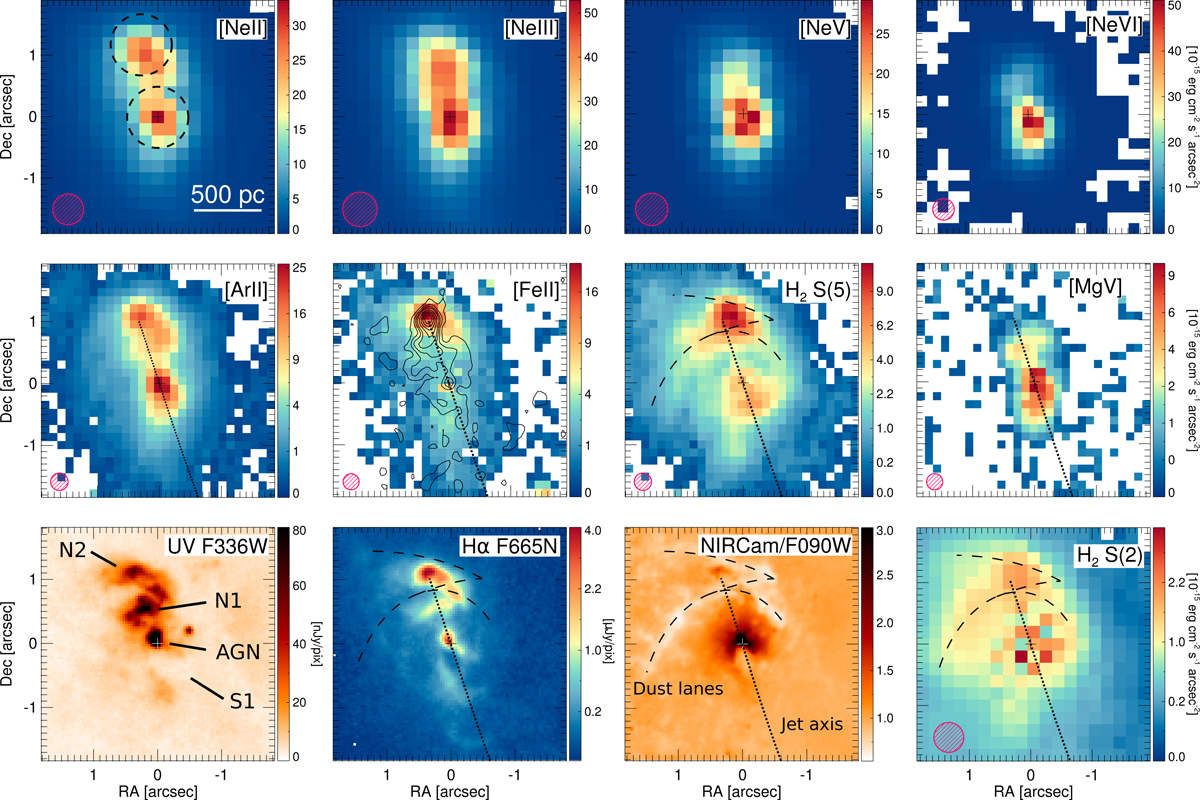
Central 3![]() 6×3
6×3![]() 6 region of NGC 7319, which includes the AGN and the northern radio lobe and hotspot N2. First row, from left to right: [Ne II]12.81 μm, [Ne III]15.56 μm, [Ne V]14.32 μm, and [Ne VI]7.65 μm MIRI MRS line maps. The dashed circles on the [Ne II] map are the AGN and N2 extraction apertures. Second row, from left to right: [Ar II]6.99 μm, [Fe II]5.34 μm, H2 S(5) 6.91 μm, and [Mg V]5.61 μm MIRI MRS line maps. The contours on the second panel represent the 1.4 GHz emission, as in Fig. 1. Third row: first two panels are the same as the top-row panels of Fig 1. The third panel is the JWST/NIRCam F090W (λp=0.90 μm) image after dividing by a Gaussian (FWHM = 14
6 region of NGC 7319, which includes the AGN and the northern radio lobe and hotspot N2. First row, from left to right: [Ne II]12.81 μm, [Ne III]15.56 μm, [Ne V]14.32 μm, and [Ne VI]7.65 μm MIRI MRS line maps. The dashed circles on the [Ne II] map are the AGN and N2 extraction apertures. Second row, from left to right: [Ar II]6.99 μm, [Fe II]5.34 μm, H2 S(5) 6.91 μm, and [Mg V]5.61 μm MIRI MRS line maps. The contours on the second panel represent the 1.4 GHz emission, as in Fig. 1. Third row: first two panels are the same as the top-row panels of Fig 1. The third panel is the JWST/NIRCam F090W (λp=0.90 μm) image after dividing by a Gaussian (FWHM = 14![]() 2) smoothed version of itself to highlight finer details. The fourth panel is the H2 S(2) 12.28 μm emission line. The dotted and dashed black lines trace the jet axis (N2 hotspot–AGN axis) and disk dust lanes, respectively. The red hatched circles represent the PSF FWHM, ∼0
2) smoothed version of itself to highlight finer details. The fourth panel is the H2 S(2) 12.28 μm emission line. The dotted and dashed black lines trace the jet axis (N2 hotspot–AGN axis) and disk dust lanes, respectively. The red hatched circles represent the PSF FWHM, ∼0![]() 26–0
26–0![]() 60 depending on the wavelength, estimated from the unresolved AGN continuum.
60 depending on the wavelength, estimated from the unresolved AGN continuum.
Current usage metrics show cumulative count of Article Views (full-text article views including HTML views, PDF and ePub downloads, according to the available data) and Abstracts Views on Vision4Press platform.
Data correspond to usage on the plateform after 2015. The current usage metrics is available 48-96 hours after online publication and is updated daily on week days.
Initial download of the metrics may take a while.