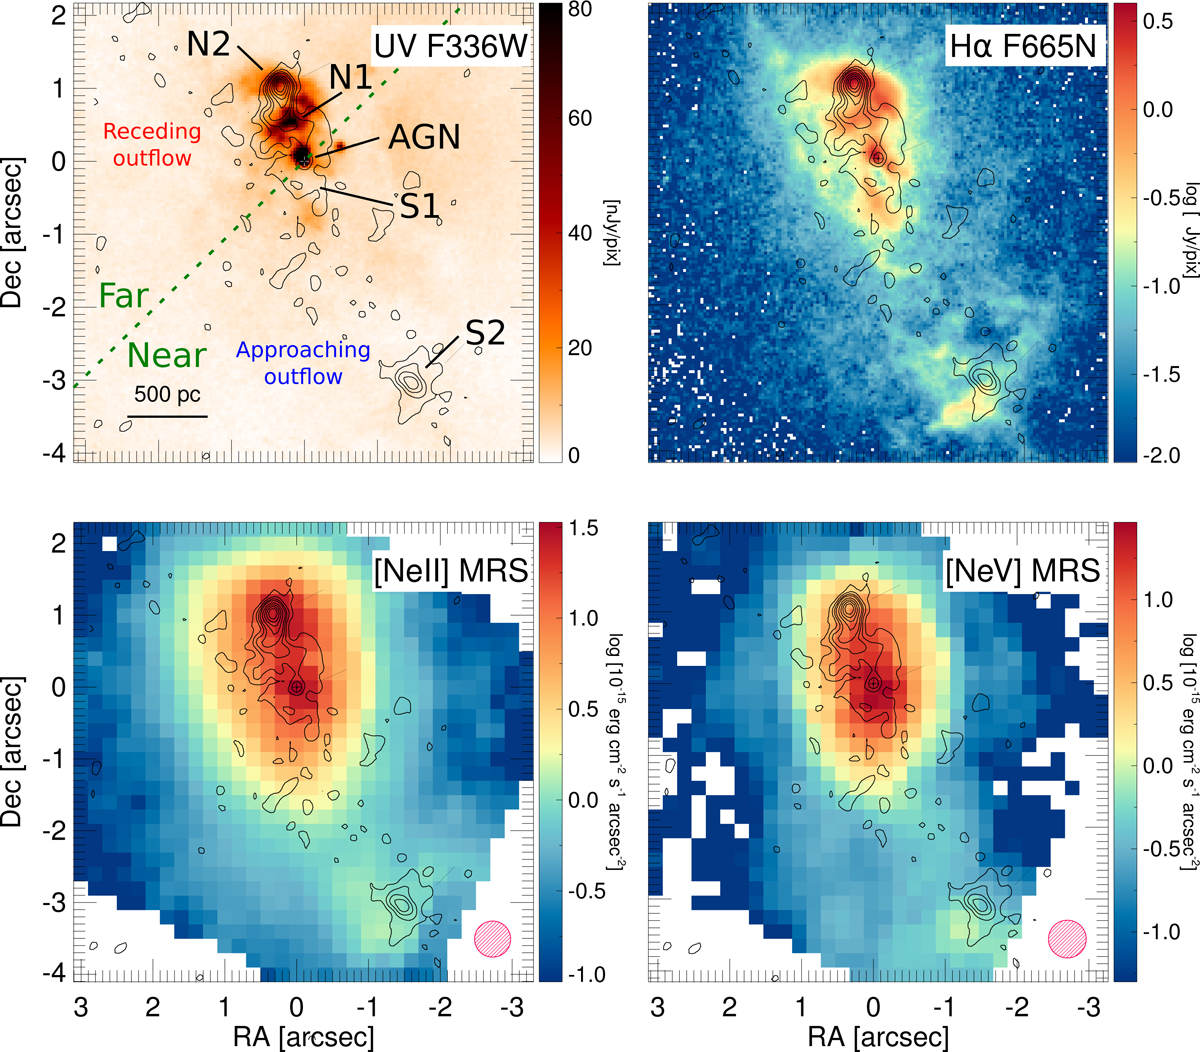
Fig. 1.
Download original image
NGC 7319 near-UV/blue image obtained with the F336W (λp = 0.335 μm) filter of HST/WFC3 (top left); Hα emission from the continuum-subtracted HST/WFC3 F665N image (top right; Appendix A.2). Bottom panels: the JWST/MIRI MRS [Ne II]12.81 μm (left) and [Ne V]14.32 μm (right) emission line maps (zeroth-moment map). The contours are the MERLIN 1.4 GHz (20 cm) radio emission map from Fig. 7 of Xanthopoulos et al. 2004. The location of the radio hotspots, N2 and S2, and the nuclear diffuse radio lobes, N1 and S1, is indicated in the top-left panel. The dashed green line marks the stellar kinematic major axis (Yttergren et al. 2021). The far and near sides of the stellar disk are indicated (see Sect. 3). The location of the receding (redshifted) and approaching (blueshifted) sides of the ionized outflow are indicated (Rodríguez-Baras et al. 2014; Yttergren et al. 2021). The red hatched circles represent the MIRI MRS PSF FWHM.
Current usage metrics show cumulative count of Article Views (full-text article views including HTML views, PDF and ePub downloads, according to the available data) and Abstracts Views on Vision4Press platform.
Data correspond to usage on the plateform after 2015. The current usage metrics is available 48-96 hours after online publication and is updated daily on week days.
Initial download of the metrics may take a while.