Fig. 3

Download original image
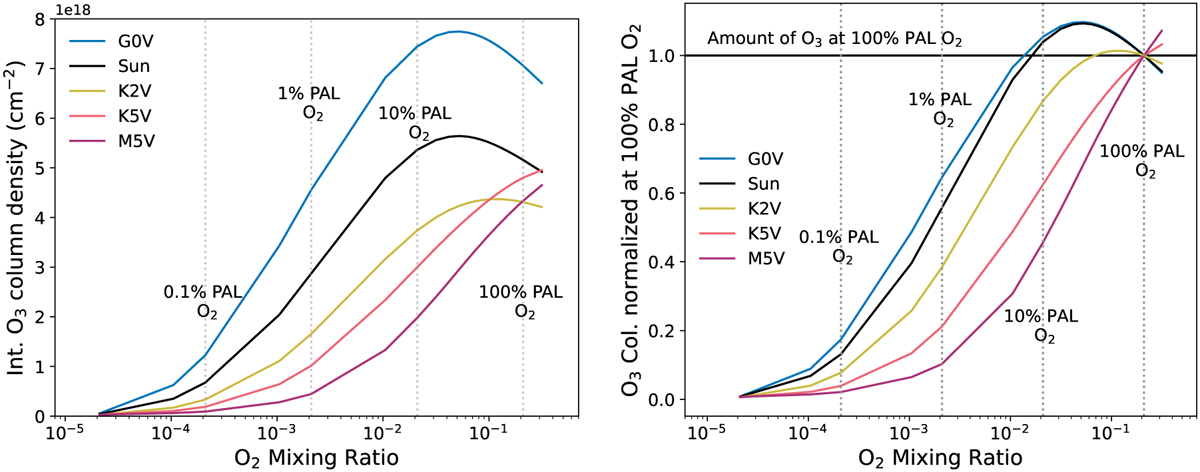
O2–O3 relationship for Earth-like planets orbiting different host stars (indicated in legend) with varying amounts of O2 mixing ratios. Molecular oxygen levels compared to Earth’s present atmospheric level (PAL) are shown as dashed vertical lines for reference. The left-hand figure shows the relationship in terms of total integrated O3 column density, and the right-hand figure in terms of total O3 normalized at the amount produced in the 100% PAL O2 case for each stellar host. The nonlinearity in these relationships is primarily due to the pressure dependence of Reaction (2) which forms O3. The main takeaway is that the O2–O3 relationship is significantly different for hotter host stars (GOV, Sun, K2V) versus cooler host stars (K5V, M5V), with hotter hosts experiencing peak O3 formation occurring at O2 levels under 100% PAL. See Sect. 4.1 for a detailed explanation.
Current usage metrics show cumulative count of Article Views (full-text article views including HTML views, PDF and ePub downloads, according to the available data) and Abstracts Views on Vision4Press platform.
Data correspond to usage on the plateform after 2015. The current usage metrics is available 48-96 hours after online publication and is updated daily on week days.
Initial download of the metrics may take a while.


