Fig. 1

Download original image
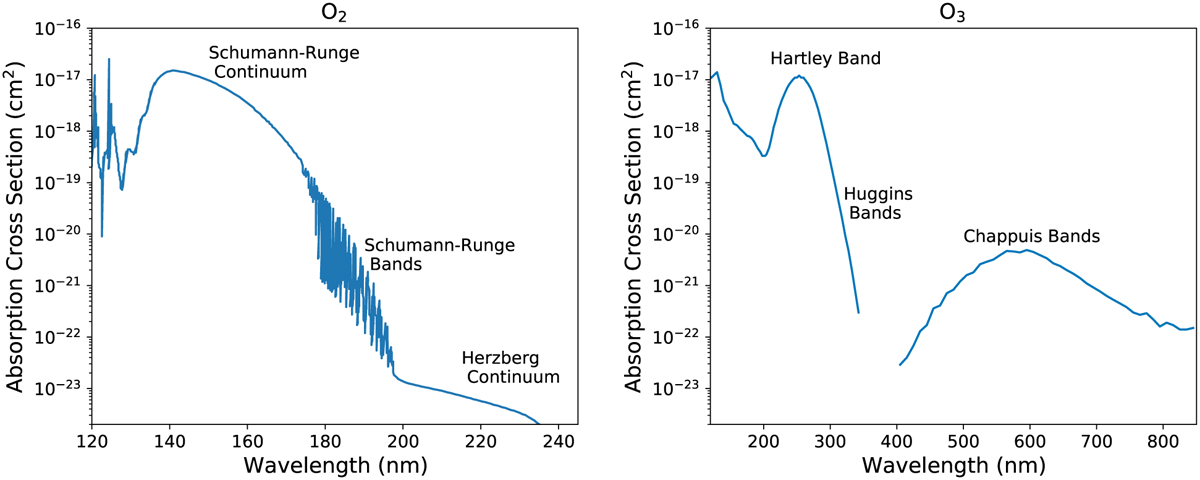
Absorption cross sections of O2 (left) and O3 (right), both plotted on the same y-axis scale to enable easier comparison. The y-axis is the same for both to enable easier comparison. Relevant O2 bands are the Schumann-Runge continuum (137–175 nm), the Schuman-Runge bands (175–200nm), and the Herzberg continuum (195–242nm). For less than 175nm an excited O atom, the O(1D) radical, is formed along with a ground state O atom during photolysis. O3 bands are the Hartley bands (200–300 nm), the Huggins bands (310–350 nm), and the Chappuis bands (410–750 nm). Photolysis within the Hartley bands will produce the O(1D) radical while other O3 bands create a ground state O atom. Absorption cross section data is from Brasseur & Solomon (2005).
Current usage metrics show cumulative count of Article Views (full-text article views including HTML views, PDF and ePub downloads, according to the available data) and Abstracts Views on Vision4Press platform.
Data correspond to usage on the plateform after 2015. The current usage metrics is available 48-96 hours after online publication and is updated daily on week days.
Initial download of the metrics may take a while.


