Fig. 5
Download original image
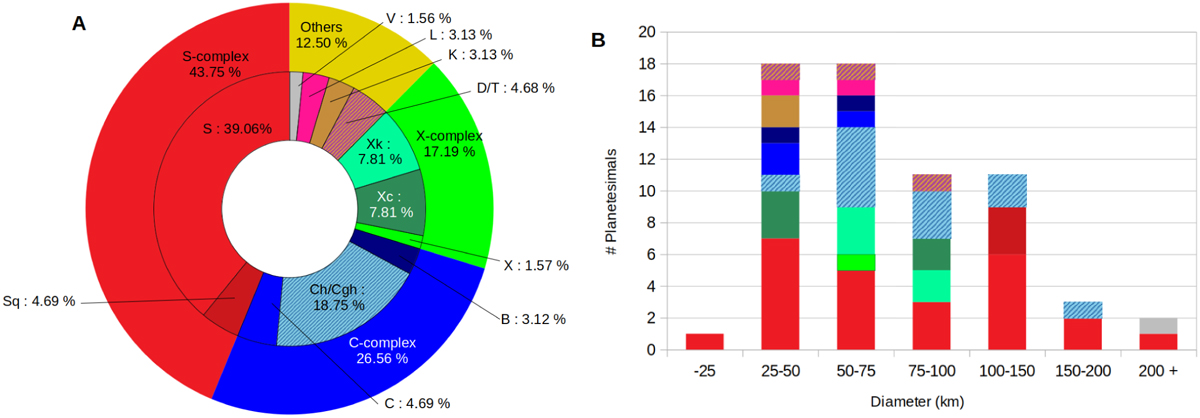
Distribution of taxonomical classes of the IMBPs. (A) Proportion of planetesimals among the four main complexes of the Bus-DeMeo taxonomy (S, C, X, and end members, noted as Others in the pie charts) and subclasses; (B) histogram of the distribution in size of all IMBPs, with the same color code as that used for the taxonomic classes.
Current usage metrics show cumulative count of Article Views (full-text article views including HTML views, PDF and ePub downloads, according to the available data) and Abstracts Views on Vision4Press platform.
Data correspond to usage on the plateform after 2015. The current usage metrics is available 48-96 hours after online publication and is updated daily on week days.
Initial download of the metrics may take a while.