Fig. 9
Download original image
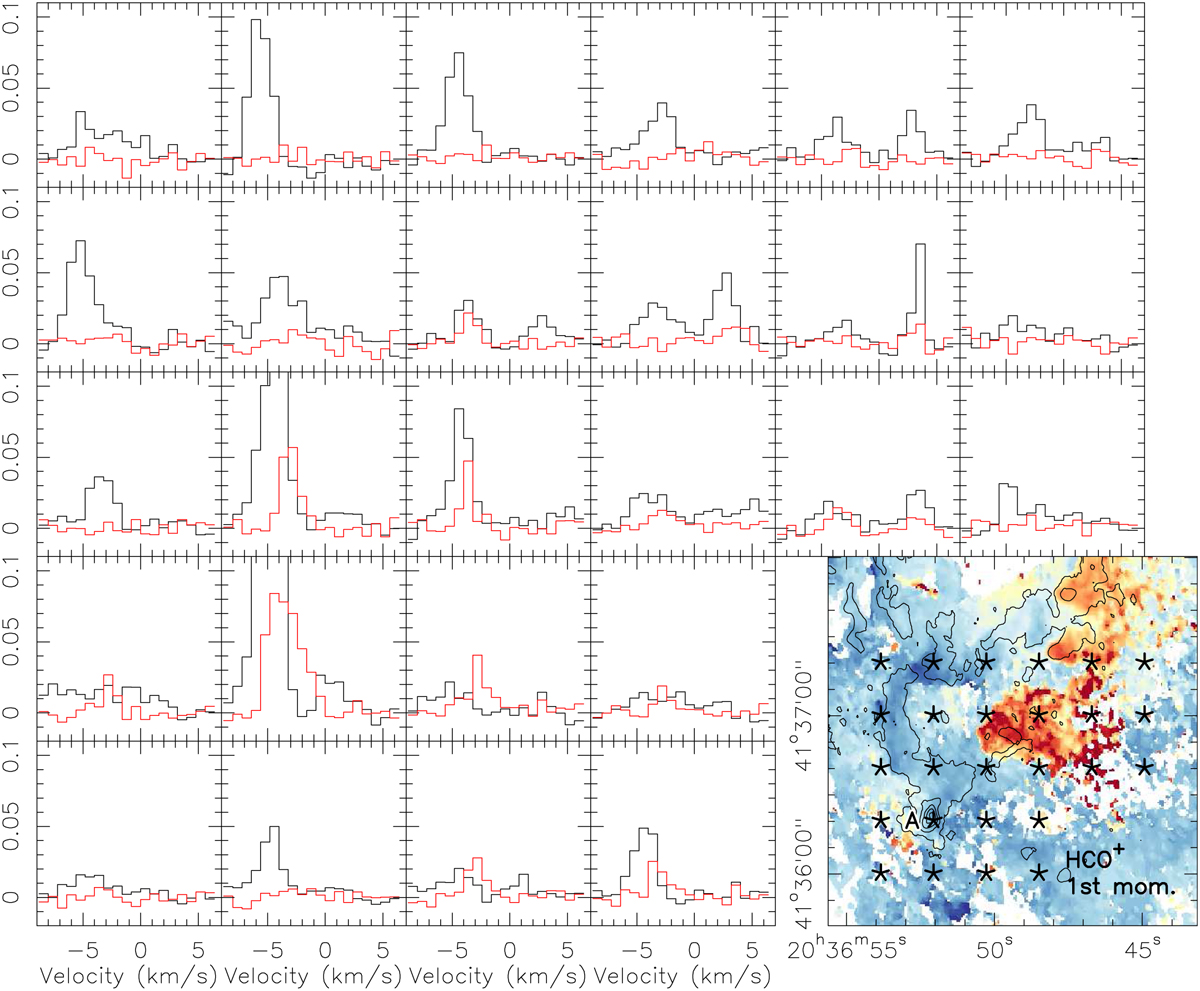
HCO+(1 − 0) and H13CO+(1 − 0) spectra in black and red, respectively, toward the northwestern region A of DR20. The y-axis of the spectra shows the flux densities in units of Jy beam−1. The color-scale in the bottom right panel shows the corresponding HCO+ first-moment map, in which the stars mark the positions of the presented spectra. The contours show the HCO+(1 − 0) integrated intensity map (from −7 to 3 km s−1) from 5 to 95% of the peak emission in steps of 10%.
Current usage metrics show cumulative count of Article Views (full-text article views including HTML views, PDF and ePub downloads, according to the available data) and Abstracts Views on Vision4Press platform.
Data correspond to usage on the plateform after 2015. The current usage metrics is available 48-96 hours after online publication and is updated daily on week days.
Initial download of the metrics may take a while.