Fig. 8
Download original image
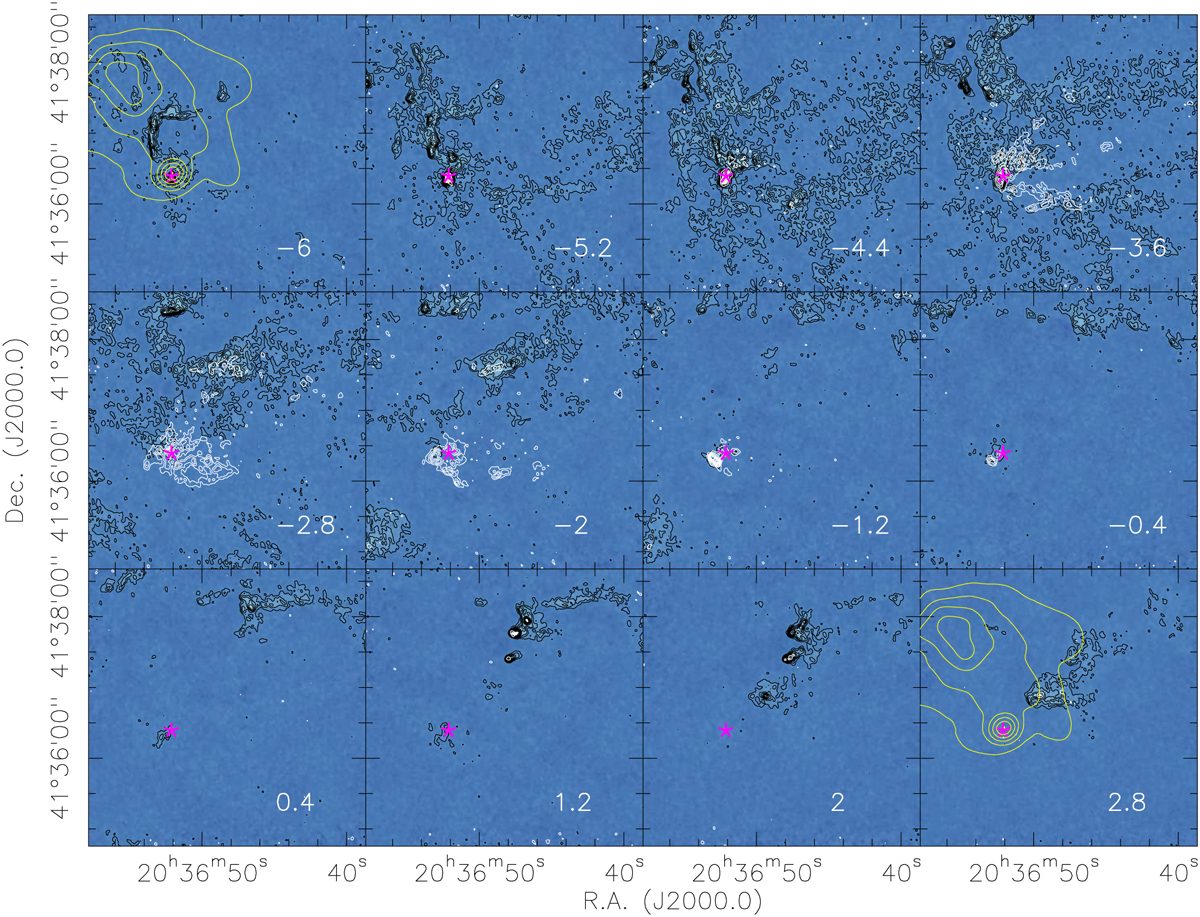
Channel maps of the western third of DR20 around region A in the HCO+(1 − 0) and H13CO+(1 − 0) emission lines. The colored and black contours show the HCO+(1 − 0) emission, whereas the white contours present the H13CO+(1 − 0) emission. Contour levels are always in 5σ steps, and the central velocity is marked in each panel. The magenta five-point stars marks the position of the main continuum peak (Fig. 5). The yellow contours in the first and last panel outline the GLOSTAR cm continuum data from 0.03 to 0.12 Jy beam−1 in steps of 0.01 Jy beam−1.
Current usage metrics show cumulative count of Article Views (full-text article views including HTML views, PDF and ePub downloads, according to the available data) and Abstracts Views on Vision4Press platform.
Data correspond to usage on the plateform after 2015. The current usage metrics is available 48-96 hours after online publication and is updated daily on week days.
Initial download of the metrics may take a while.