Fig. 6
Download original image
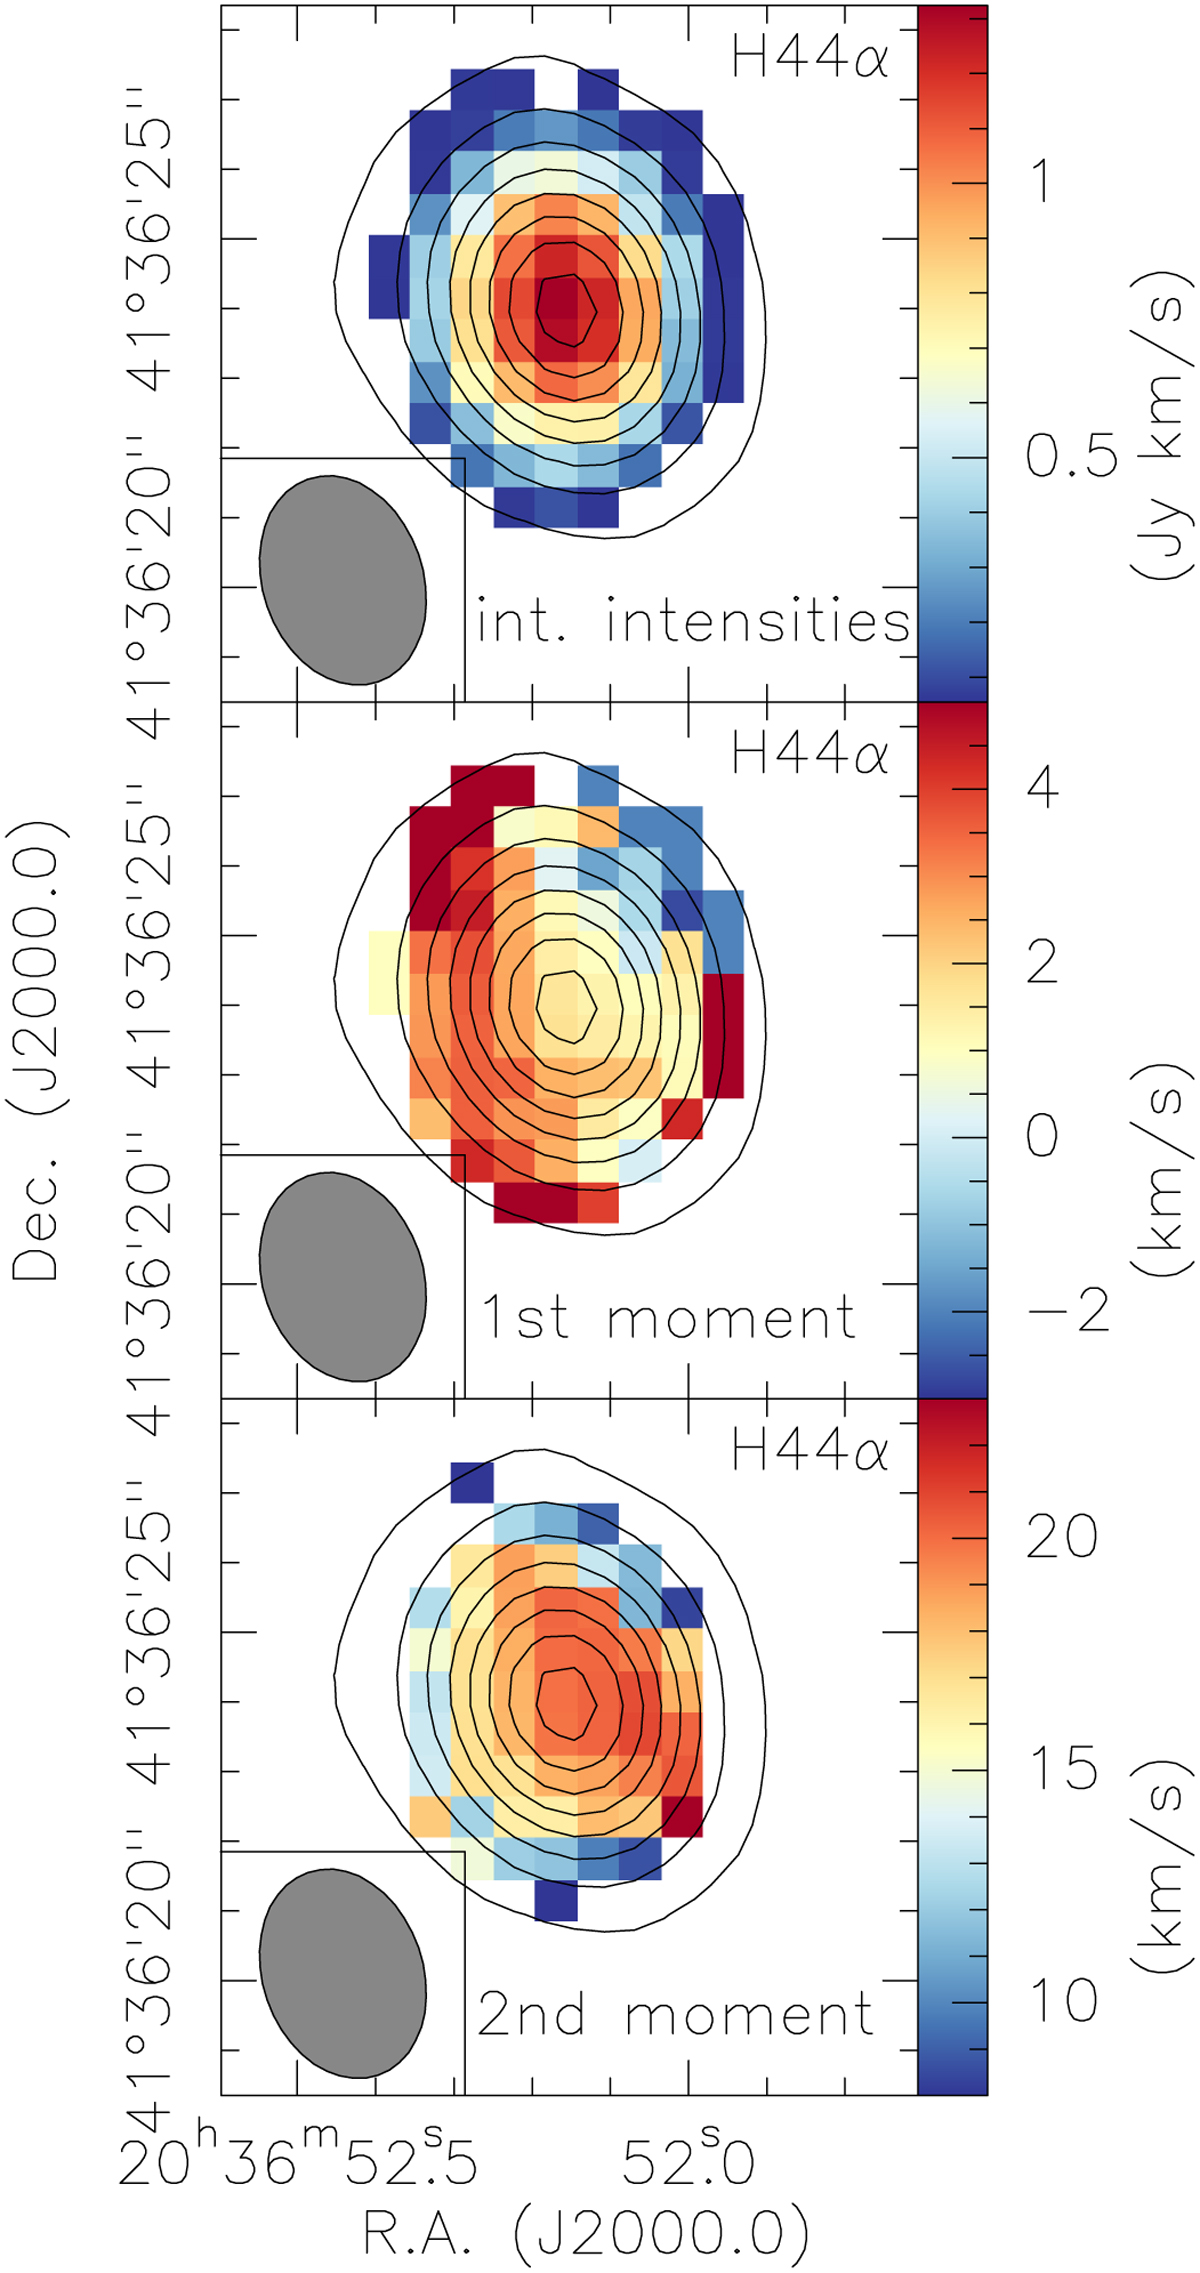
Integrated intensities (top), first- (middle) and second -moment (bottom) maps of the H44α radio recombination line are shown in color scale panel. The integration ranges are always from −20 to 20 km s−1. The data were clipped below the 4σ level (Table 1). The contours show the 3.6 mm continuum data on contour levels from 8 to 78 mJy beam−1 (step 10 mJy beam−1). The beam is shown in the bottom left corner of each panel.
Current usage metrics show cumulative count of Article Views (full-text article views including HTML views, PDF and ePub downloads, according to the available data) and Abstracts Views on Vision4Press platform.
Data correspond to usage on the plateform after 2015. The current usage metrics is available 48-96 hours after online publication and is updated daily on week days.
Initial download of the metrics may take a while.