Fig. 5
Download original image
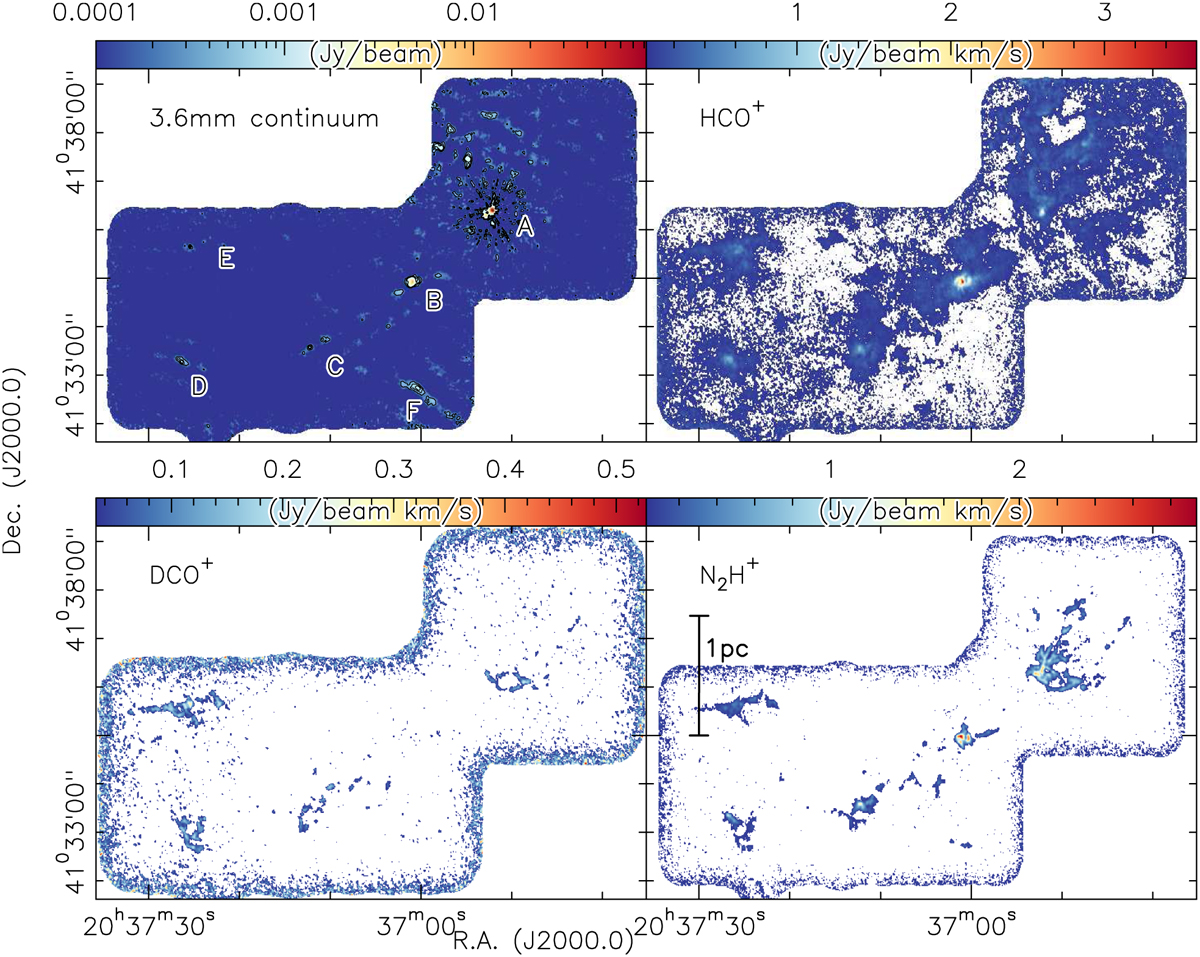
Millimeter continuum and selected integrated intensity images. The upper left panel shows the 3.6 mm continuum emission (NOEMA only), and the other panels show integrated intensity images for the species marked in each panel (NOEMA+30m). For the latter, the integration ranges are always from −7 to 3 km s−1. The data were clipped below the 4σ level for each species (Table 1). The bottom right panel also shows a linear scale-bar. The six main regions A to F are labeled in the continuum panel. The continuum image also shows the lower continuum contour levels in 6σ steps of 0.3 mJy beam−1 up to 0.9 mJy beam−1. Additional maps for other species are shown in Figs. A.1 and A.2.
Current usage metrics show cumulative count of Article Views (full-text article views including HTML views, PDF and ePub downloads, according to the available data) and Abstracts Views on Vision4Press platform.
Data correspond to usage on the plateform after 2015. The current usage metrics is available 48-96 hours after online publication and is updated daily on week days.
Initial download of the metrics may take a while.