Fig. 3
Download original image
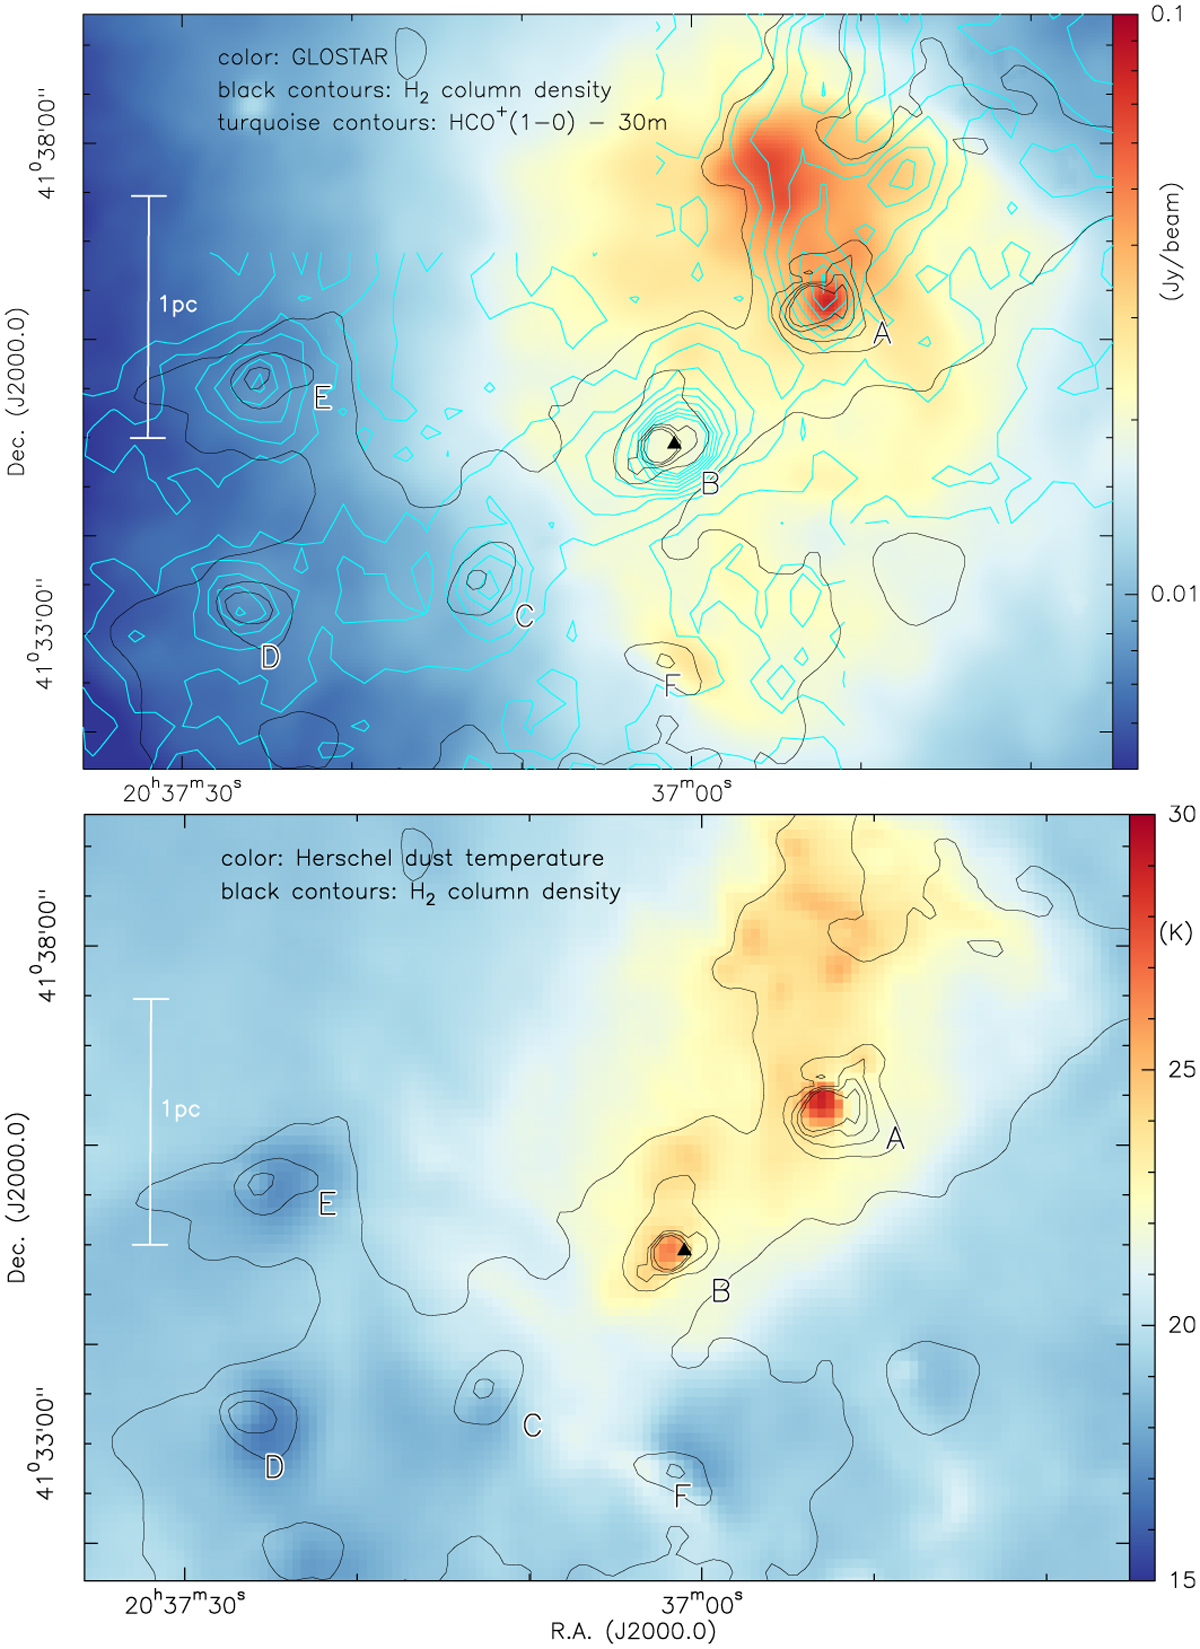
Overview of the DR20 region. Top panel: Radio continuum emission from the GLOSTAR survey at 5.8 GHz with an angular resolution of 19” (corresponding to 0.13pc) is shown on the color scale (Brunthaler et al. 2021). The turquoise contours present the HCO+(1 – 0) data obtained with the IRAM 30 m telescope, integrated between −7 and 3kms−1. Contour levels start at 4σ = 3.4 K kms−1 and continue in 4σ steps. Bottom panel: Dust temperature map derived from the Herschel far-infrared continuum data by Marsh et al. (2017) is show on the color scale. In both panels, the black contours show the H2 column density map derived by Marsh et al. (2017) at contour levels between 1022 and 5 × 1022 cm−2 (step 1 × 10²²). A linear scale-bar is shown at the left. The six main regions A to F are marked, and a triangle shows the position of the class II CH3OH maser associated with B that has been determined by Ortiz-León et al. (2021).
Current usage metrics show cumulative count of Article Views (full-text article views including HTML views, PDF and ePub downloads, according to the available data) and Abstracts Views on Vision4Press platform.
Data correspond to usage on the plateform after 2015. The current usage metrics is available 48-96 hours after online publication and is updated daily on week days.
Initial download of the metrics may take a while.