Open Access
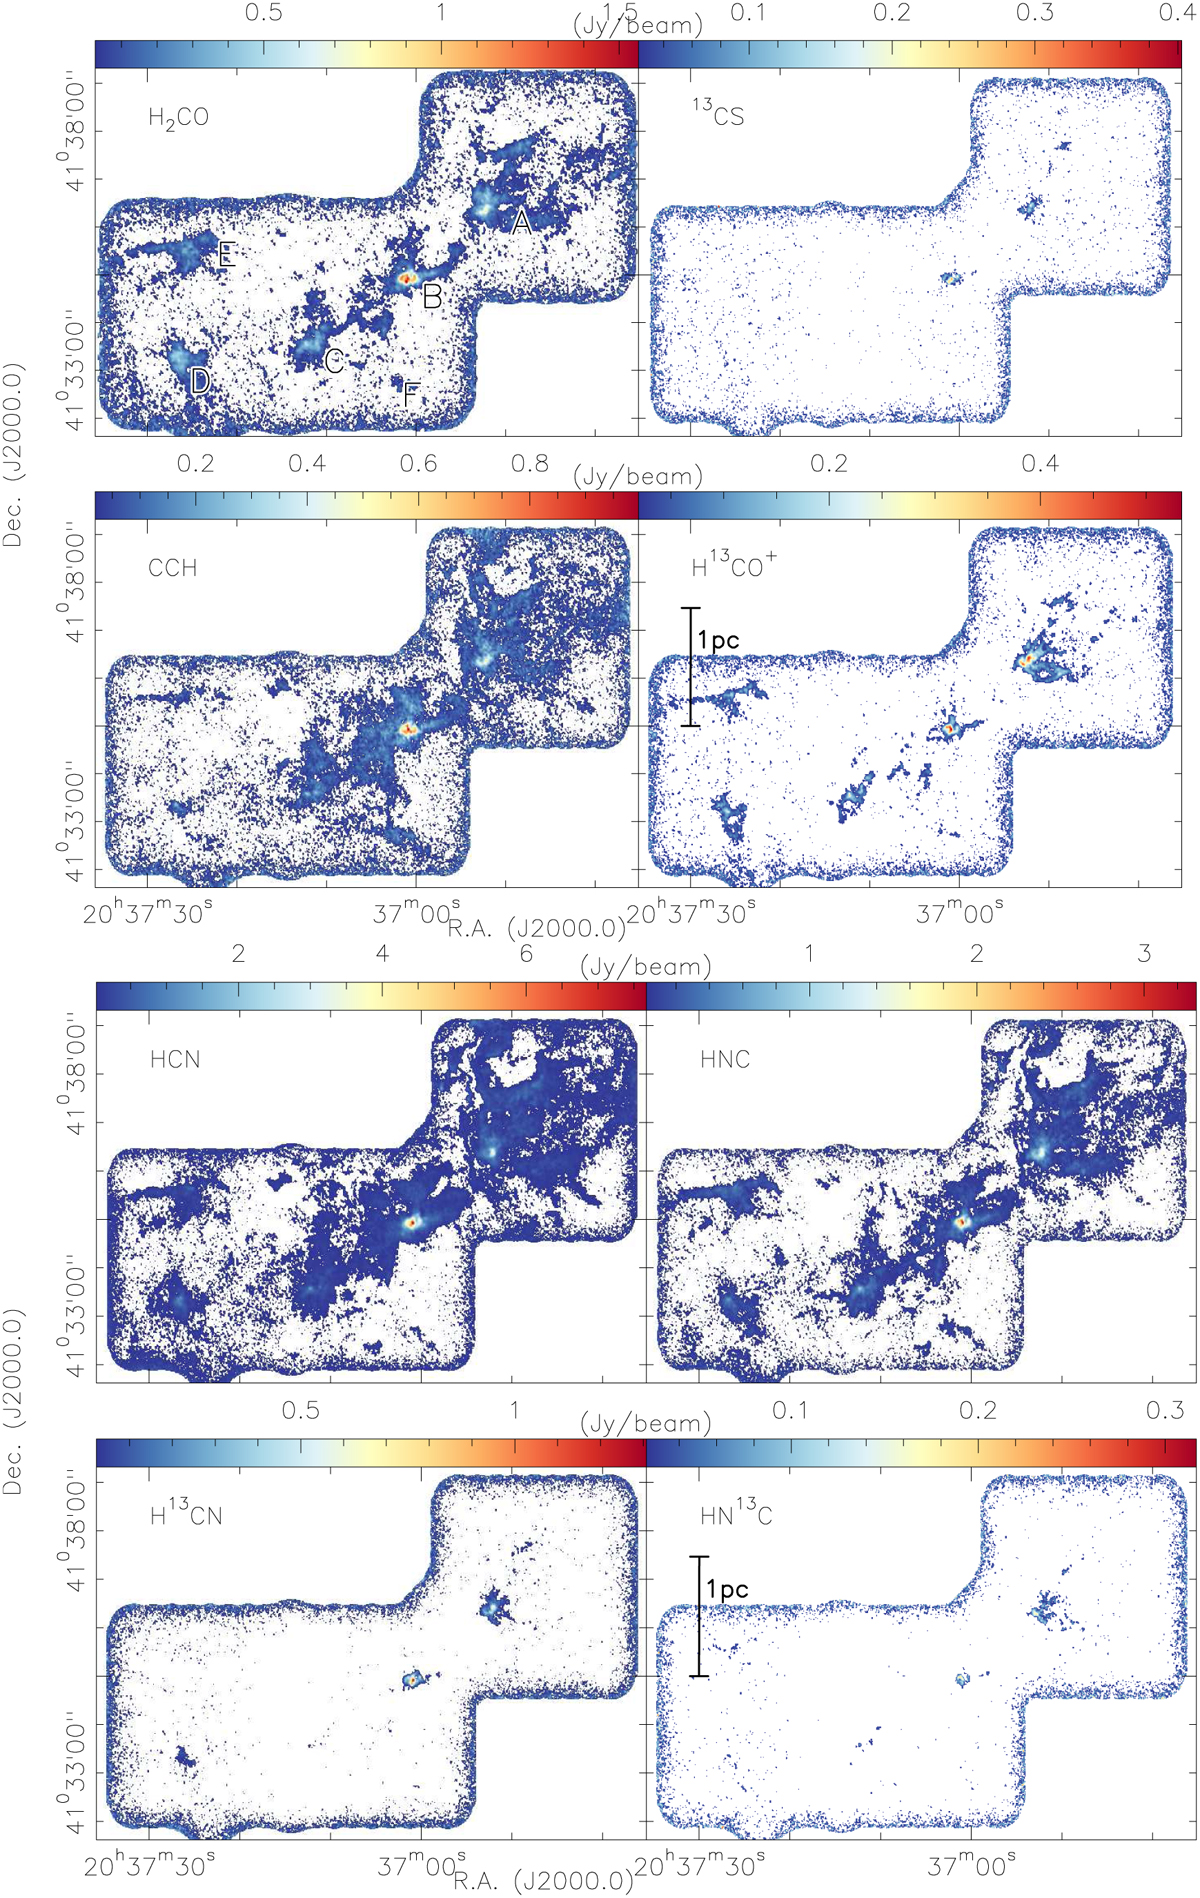
Fig. A.1
Download original image
Integrated intensities for the species marked in each panel. The integration ranges are always from −7 to 3 km s−1. Only for HCN and H13CN were broader integration ranges from −14 to 8 km s−1 used to cover all hyperfine structures of the line. The data were clipped below the 4σ level for each species (Table 1).
Current usage metrics show cumulative count of Article Views (full-text article views including HTML views, PDF and ePub downloads, according to the available data) and Abstracts Views on Vision4Press platform.
Data correspond to usage on the plateform after 2015. The current usage metrics is available 48-96 hours after online publication and is updated daily on week days.
Initial download of the metrics may take a while.