Fig. 16
Download original image
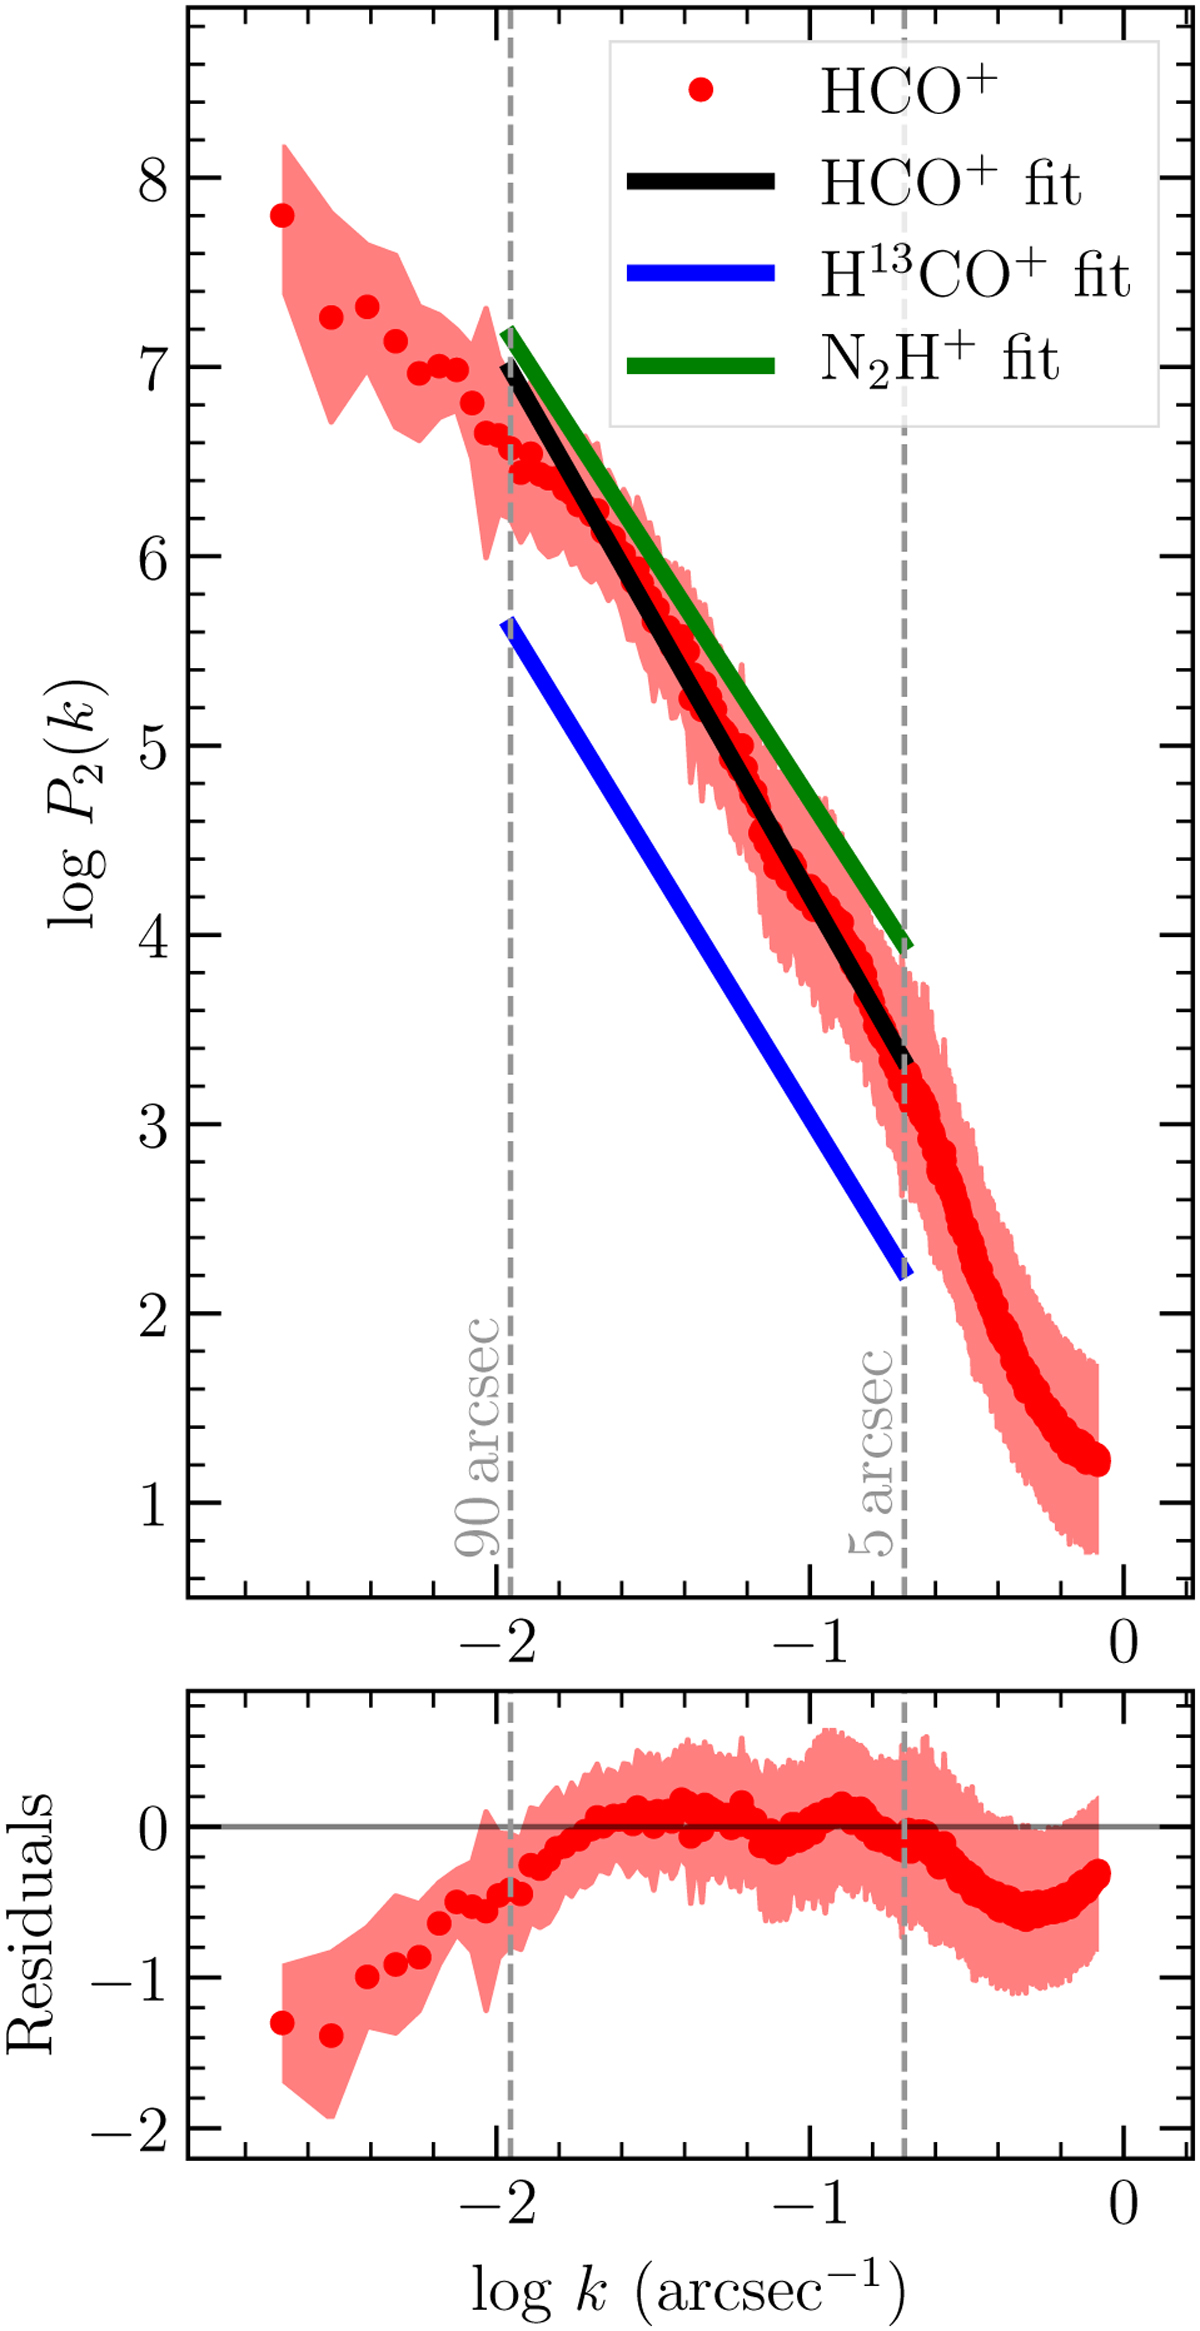
Power spectra derived in DR20 for HCO+ (1 − 0), H13CO+(1 − 0) and N2H+(1 − 0). The dots and colored area correspond to the HCO+ data and their 1 σ uncertainty. The black line is the fit to the data between 5″ and 90″. For comparison, we show the fits to the corresponding H13CO+ and N2H+ in blue and green. The bottom panel presents the residuals of the HCO+ fit.
Current usage metrics show cumulative count of Article Views (full-text article views including HTML views, PDF and ePub downloads, according to the available data) and Abstracts Views on Vision4Press platform.
Data correspond to usage on the plateform after 2015. The current usage metrics is available 48-96 hours after online publication and is updated daily on week days.
Initial download of the metrics may take a while.