Fig. 15
Download original image
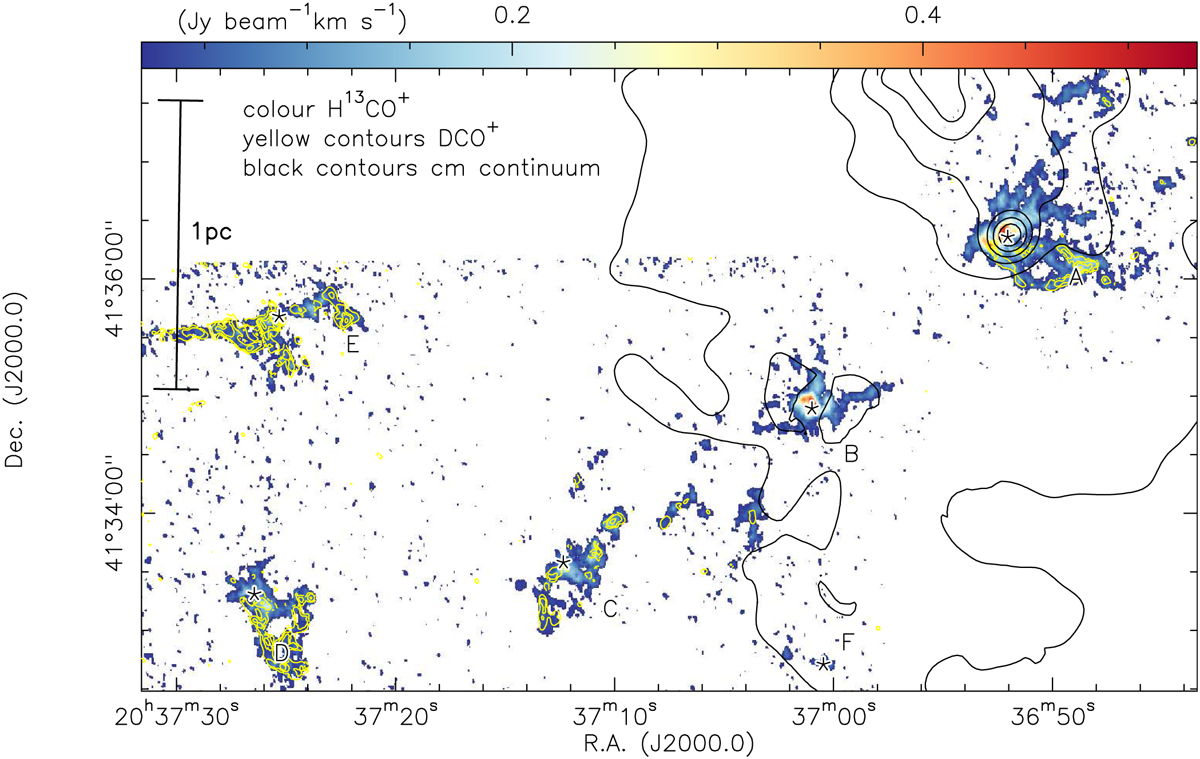
Integrated DCO+(1 – 0) contours in yellow on H13CO+(1 − 0) emission in color. The integration regimes for the two molecular transitions are from −7 to 3 km s−1. The yellow DCO+ contours are from 50 to 500 mJy beam−1km s−1 in steps of 50 mJy beam−1 k ms−1. The black contours show the GLOSTAR cm continuum emission from 20 to 100 mJy beam−1 in steps of 10 mJy beam−1. A linear scale-bar is shown to the left, and the six main regions A to F are labeled and marked by five-point stars.
Current usage metrics show cumulative count of Article Views (full-text article views including HTML views, PDF and ePub downloads, according to the available data) and Abstracts Views on Vision4Press platform.
Data correspond to usage on the plateform after 2015. The current usage metrics is available 48-96 hours after online publication and is updated daily on week days.
Initial download of the metrics may take a while.