Fig. 14
Download original image
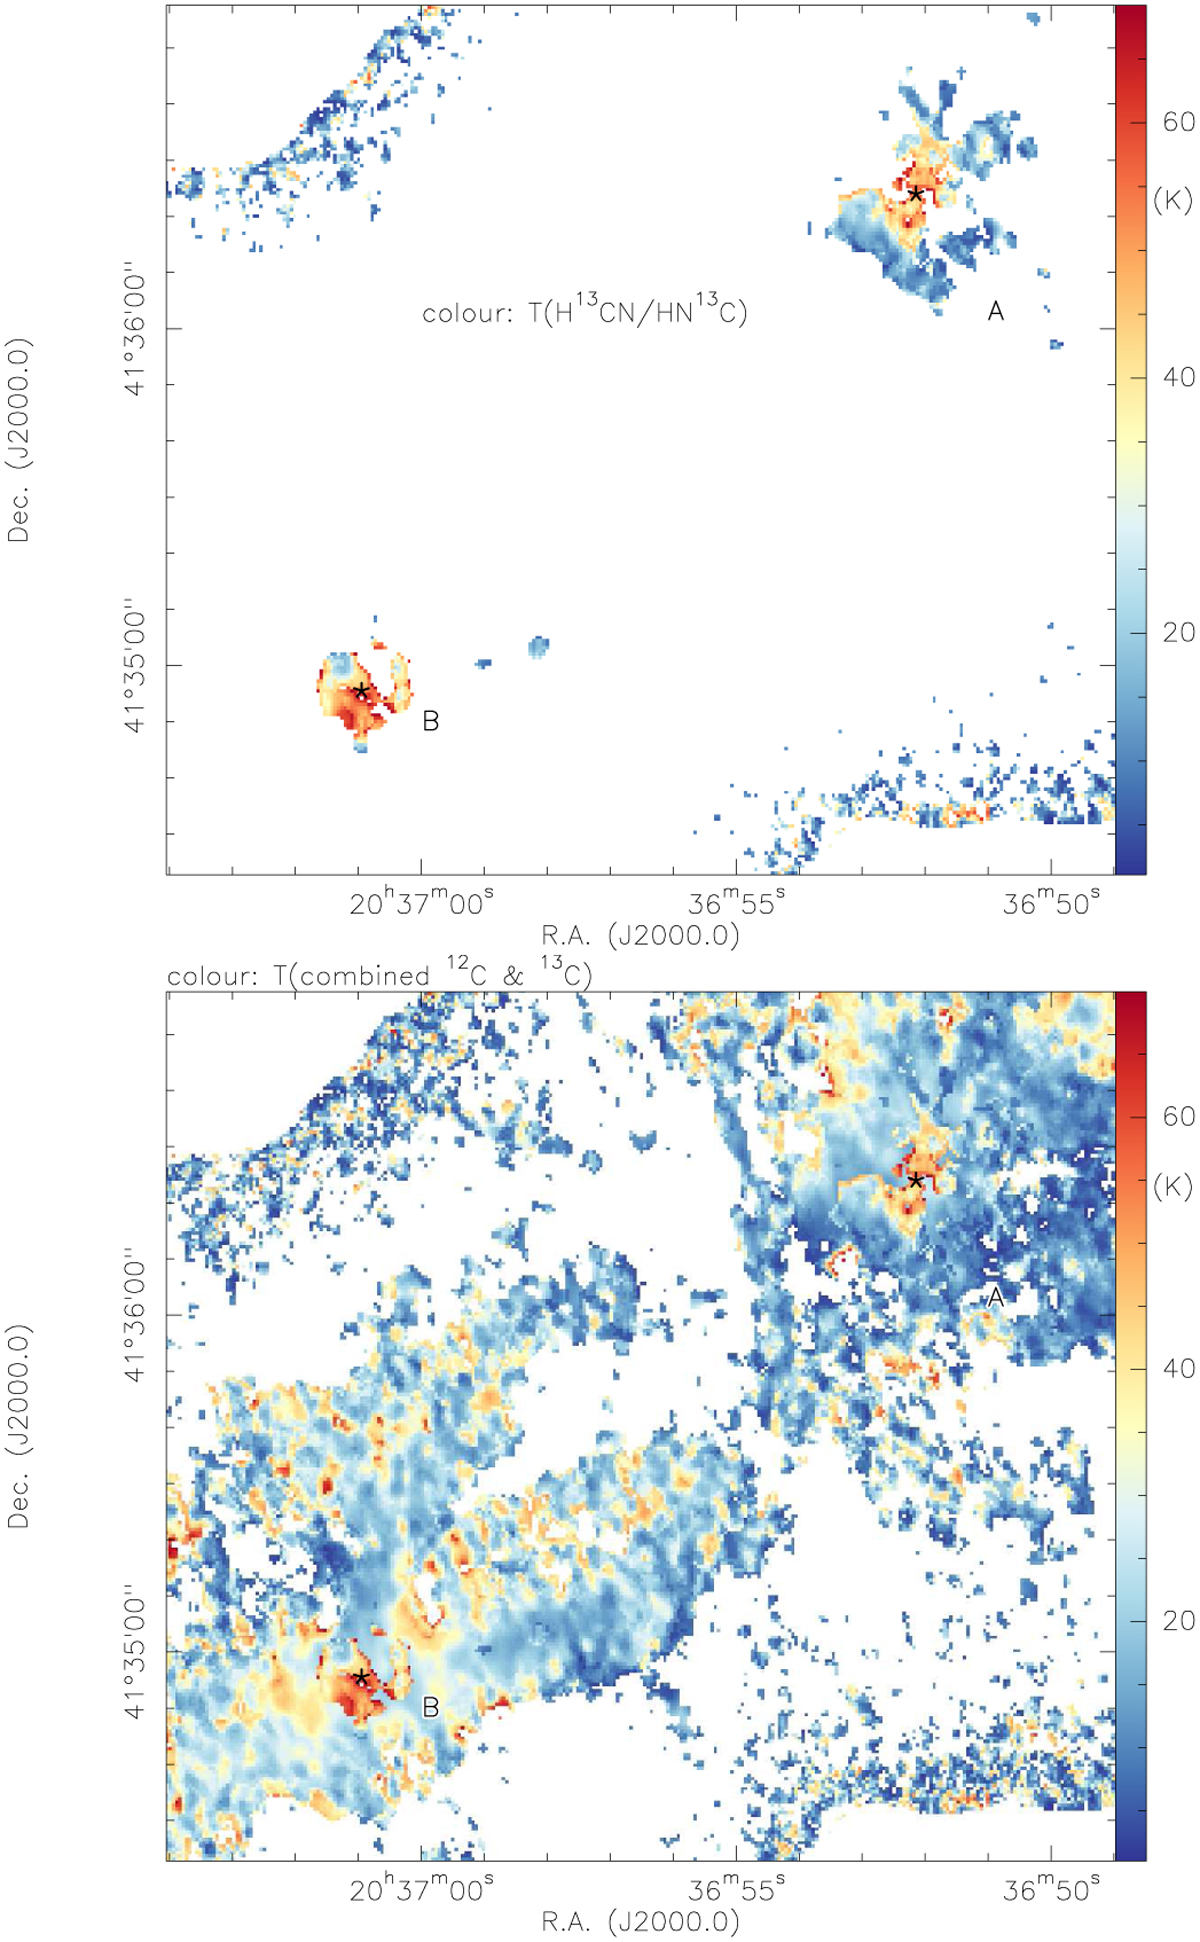
Temperature maps using also the H13CN/HN13C ratio. Top panel: temperature map derived from the integrated intensity ratios of the H13CN(1–0) and HN13C(1–0) line following the procedure outlined in Hacar et al. (2020) for the main isotopologs. The five-point stars mark the 3.6 mm continuum peak positions of region A and B. The bottom panel presents the corresponding temperature map where the temperatures derived from HCN/HNC and Hi3CN/HNi3C are combined (see main text for procedure).
Current usage metrics show cumulative count of Article Views (full-text article views including HTML views, PDF and ePub downloads, according to the available data) and Abstracts Views on Vision4Press platform.
Data correspond to usage on the plateform after 2015. The current usage metrics is available 48-96 hours after online publication and is updated daily on week days.
Initial download of the metrics may take a while.