Fig. 13
Download original image
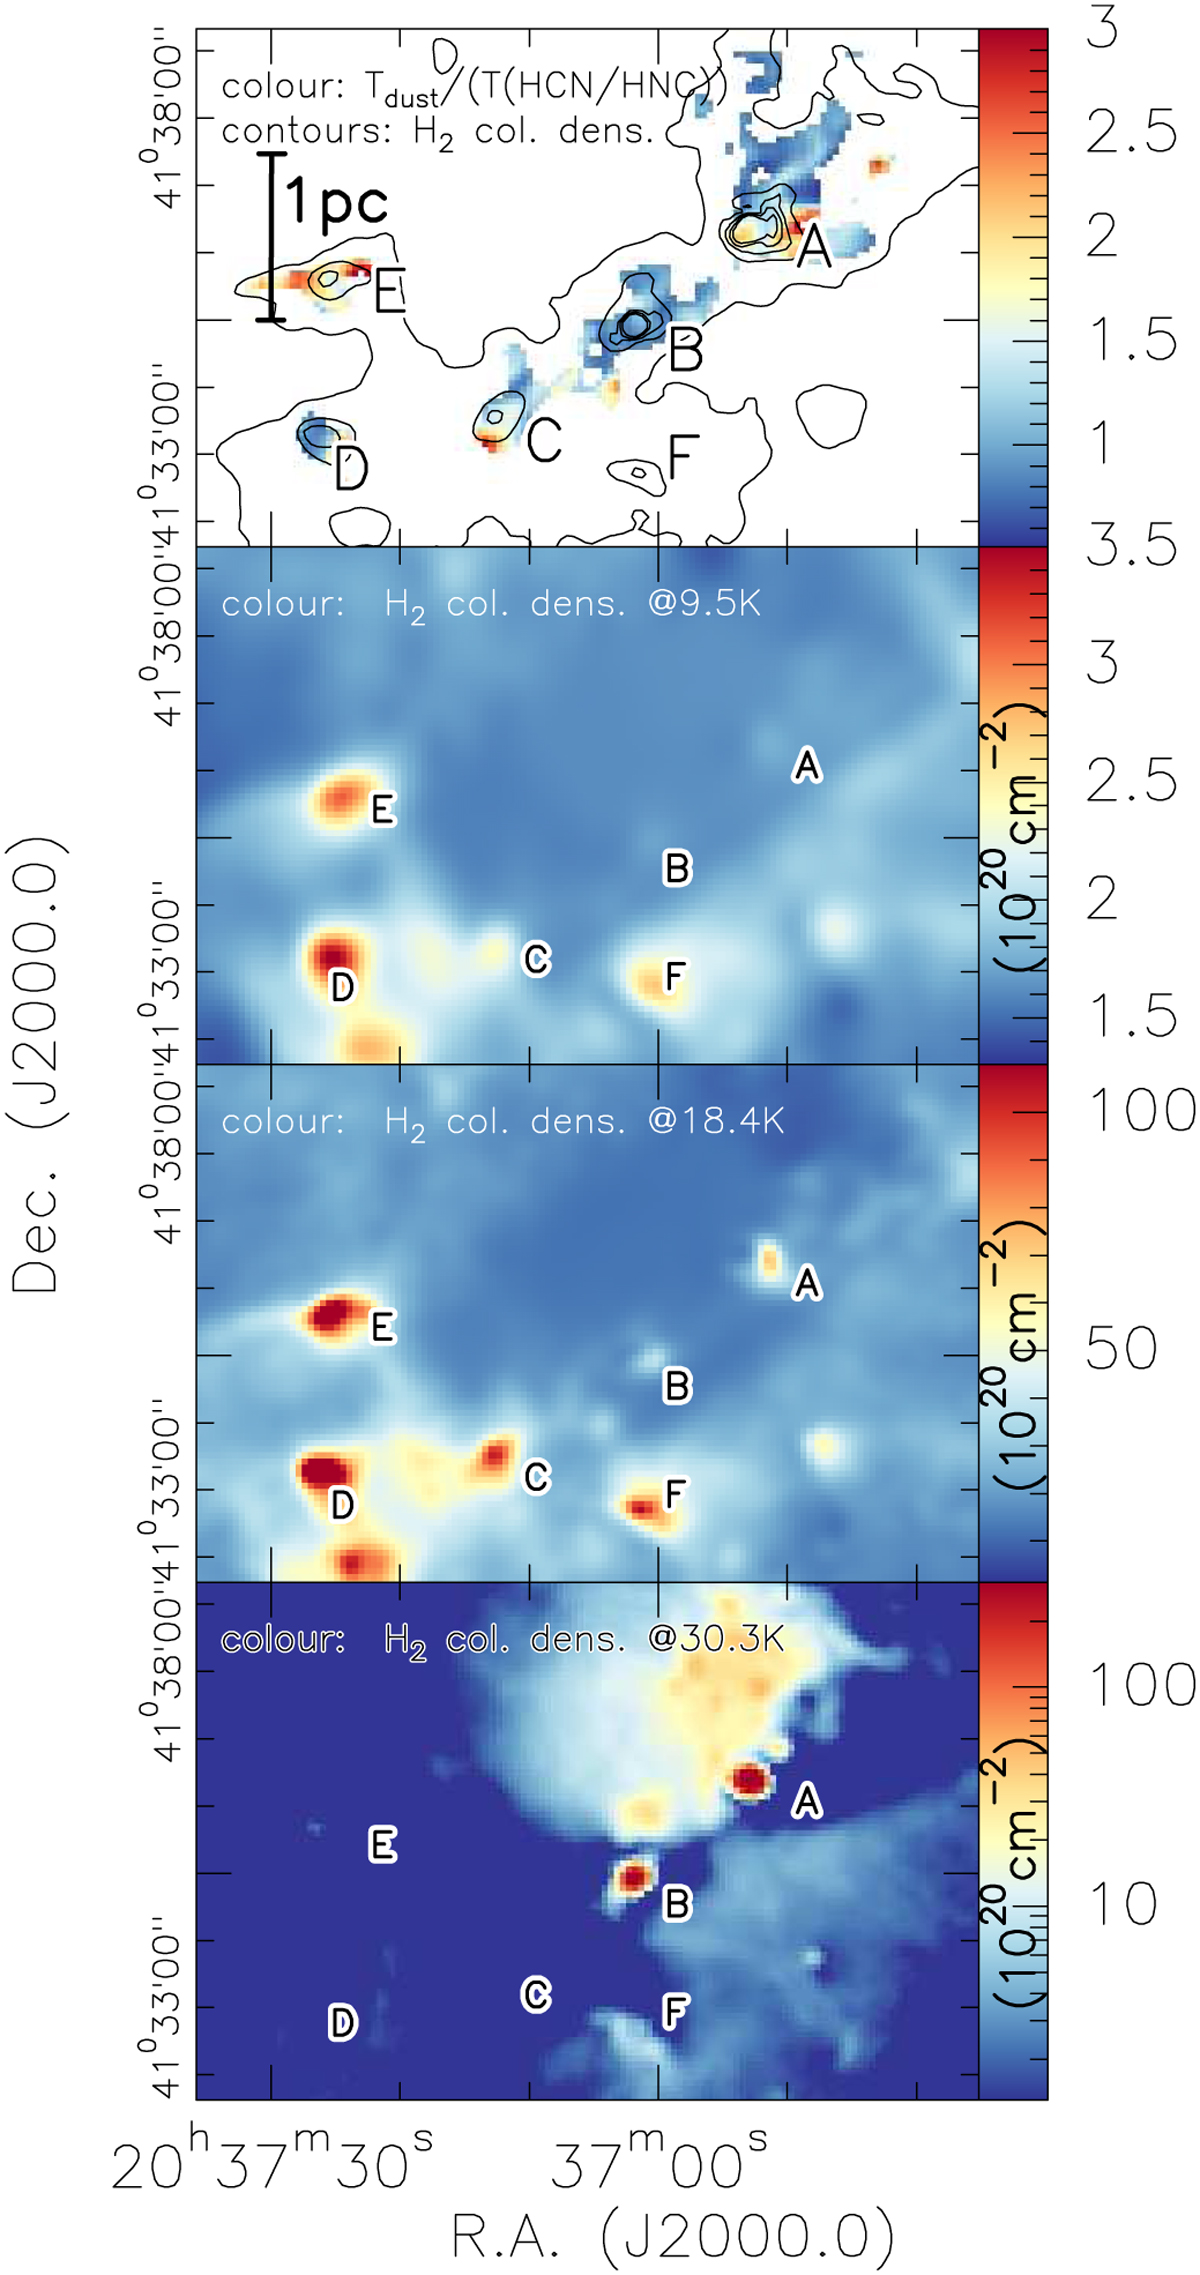
Temperature ratio map and column density maps at different temperatures. Top panel: ratio map of the temperatures derived from the Herschel far-infrared data (Fig. 3; Marsh et al. 2017) vs. the temperature map obtained from the HCN/HNC ratio (Fig. 11). For this ratio map, the HCN and HNC data were first smoothed to the 12″ resolution of the dust temperature map. The black contours show the H2 column density map derived by Marsh et al. (2017) at contour levels between 1022 and 5 × 1022 cm−2 (step 1 × 1022 cm−2). A linear scale-bar is shown to the left. The bottom three panels show the H2 column densities derived at different temperatures (as marked in the panels) as outlined in Marsh et al. (2017). The six main regions A to F are marked in all panels.
Current usage metrics show cumulative count of Article Views (full-text article views including HTML views, PDF and ePub downloads, according to the available data) and Abstracts Views on Vision4Press platform.
Data correspond to usage on the plateform after 2015. The current usage metrics is available 48-96 hours after online publication and is updated daily on week days.
Initial download of the metrics may take a while.