Fig. 11
Download original image
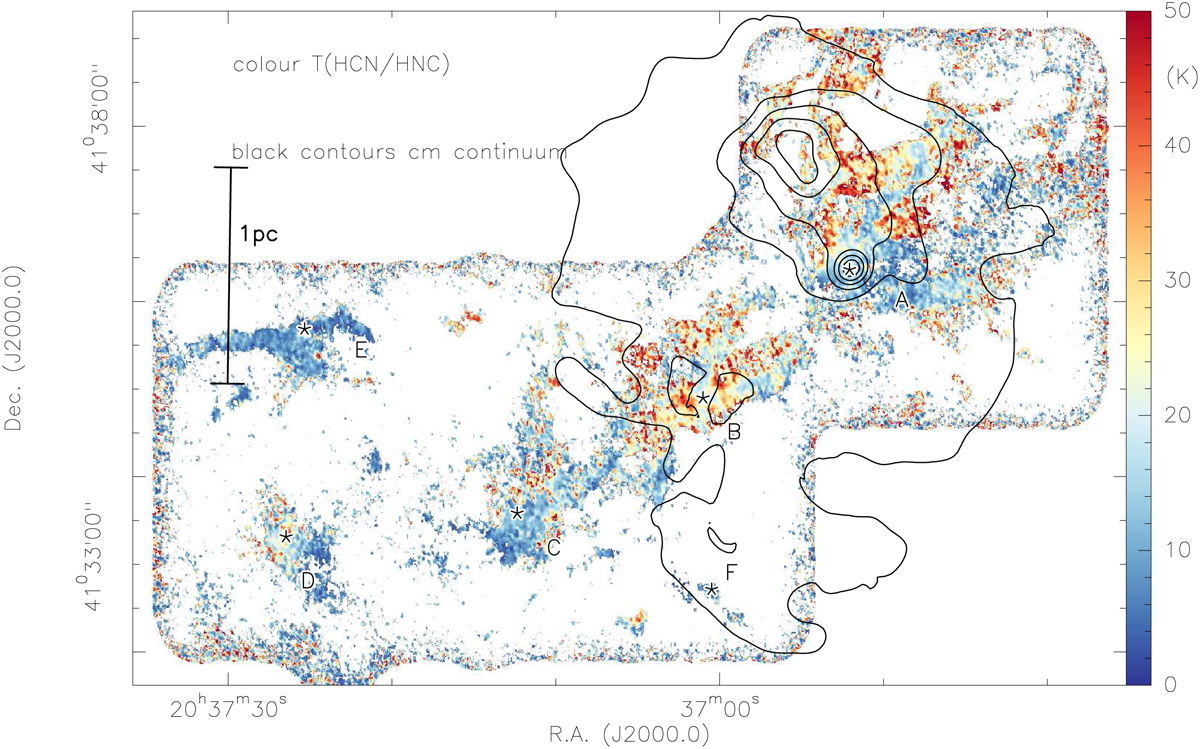
Temperature map from the HCN/HNC ratio. The color-scale shows the temperature map derived from the integrated intensity ratios of the HCN(1−0) and HNC(1−0) line following Hacar et al. (2020). The black contours show the GLOSTAR cm continuum emission from 20 to 100 mJy beam−1 in steps of 10 mJy beam−1. The 3.6 mm continuum positions are marked as five-point stars. A linear scale-bar is shown at the left, and the six main regions A to F are labeled.
Current usage metrics show cumulative count of Article Views (full-text article views including HTML views, PDF and ePub downloads, according to the available data) and Abstracts Views on Vision4Press platform.
Data correspond to usage on the plateform after 2015. The current usage metrics is available 48-96 hours after online publication and is updated daily on week days.
Initial download of the metrics may take a while.