Open Access
Fig. 10
Download original image
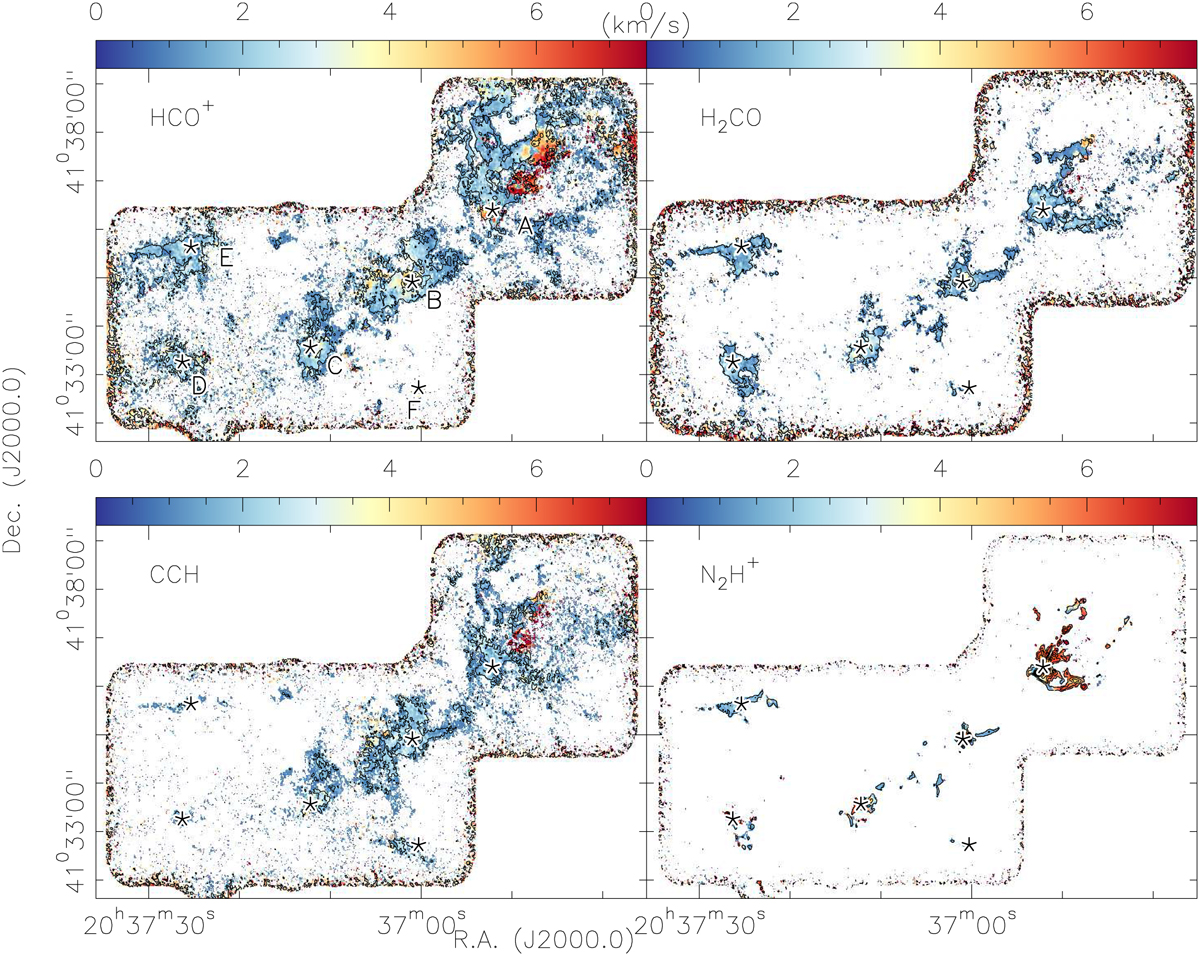
Second-moment maps: the color scale always shows the second-moment for the labeled species. The black contours outline the integrated emission of the same species, always contoured from 0.1 to 2.9 Jy beam−1 km s−1 in steps of 0.3 Jy beam−1 km s−1. The 3.6 mm continuum peak positions are marked with five-point stars.
Current usage metrics show cumulative count of Article Views (full-text article views including HTML views, PDF and ePub downloads, according to the available data) and Abstracts Views on Vision4Press platform.
Data correspond to usage on the plateform after 2015. The current usage metrics is available 48-96 hours after online publication and is updated daily on week days.
Initial download of the metrics may take a while.