Fig. 1
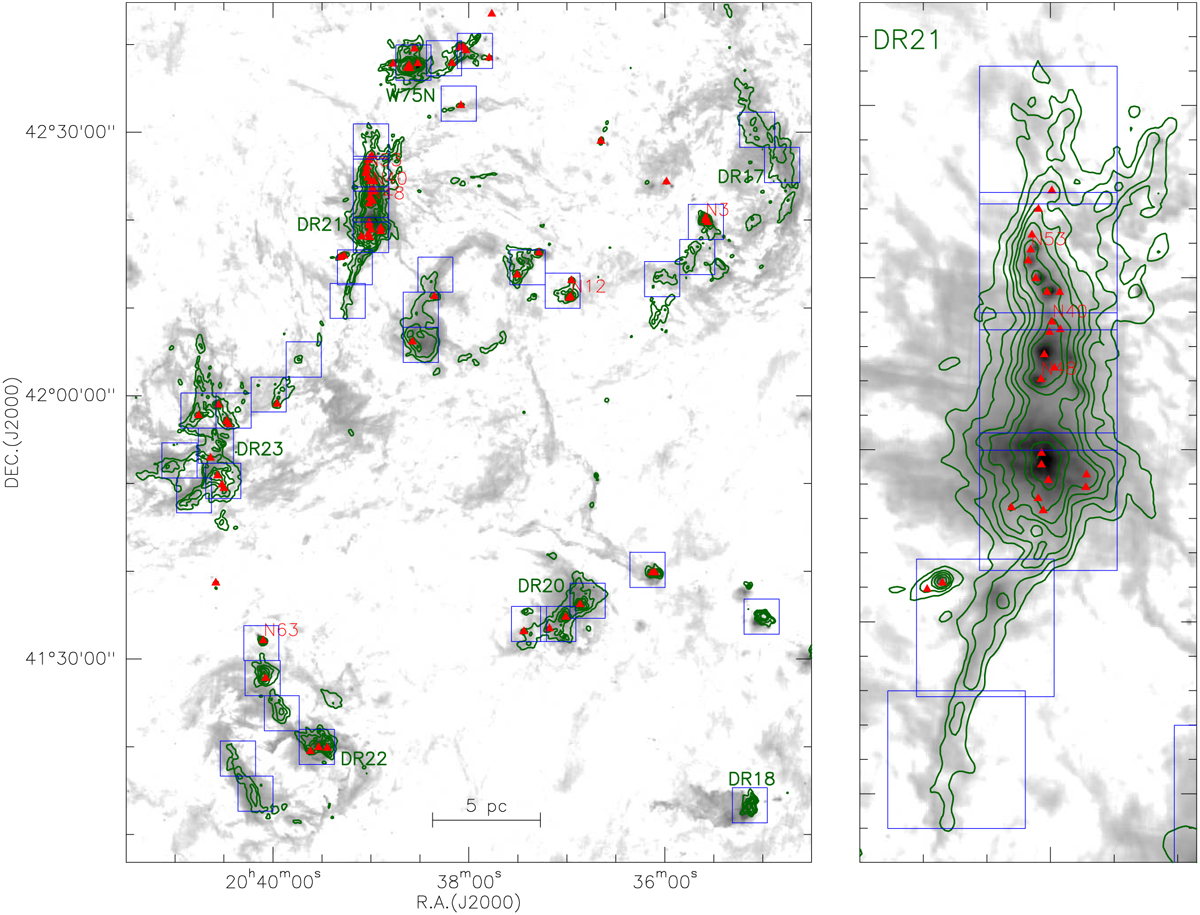
Download original image
Cygnus X as seen in Herschel SPIRE 250 um (green contours) and PACS 70 um emission (grayscale, from the HOBYS program, Motte et al. 2010). The red triangles show the mm clumps previously identified in 11″ resolution 1.1 mm single-dish mapping (Motte et al. 2007). The blue squares indicate the 16 arcmin2 NOEMA mosaics. To the right, a zoom into the DR21 ridge is shown.
Current usage metrics show cumulative count of Article Views (full-text article views including HTML views, PDF and ePub downloads, according to the available data) and Abstracts Views on Vision4Press platform.
Data correspond to usage on the plateform after 2015. The current usage metrics is available 48-96 hours after online publication and is updated daily on week days.
Initial download of the metrics may take a while.