Fig. 6
Download original image
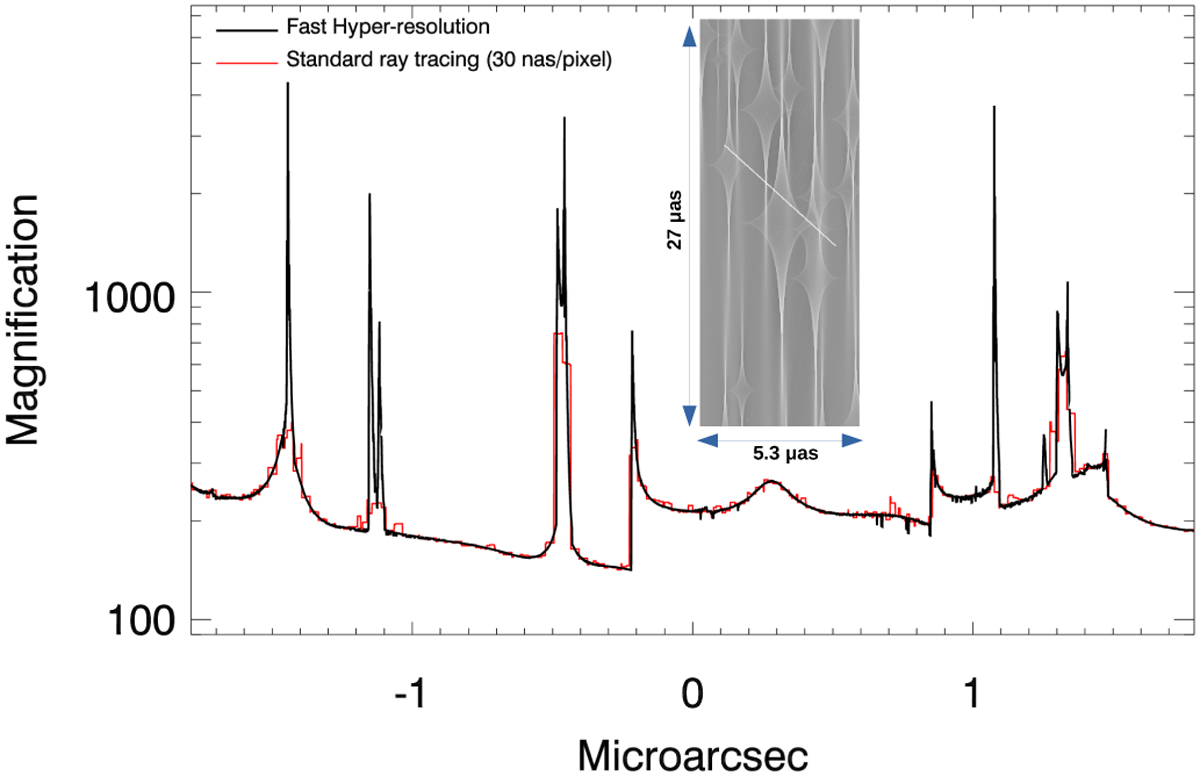
Example of a light curve in a crowded field. The surface mass density of microlenses is ≈2 M⊙ pc−2, a typical value responsible for the intracluster light (ICL) near the tangential critical curves of high redshift sources. The black solid line shows the light curve for a 20 solar radii background star and it is compared with the ray tracing solution (red curve) for a resolution of 30 nas per pixel. As in the previous examples, ray tracing cannot capture the fine details near the microcaustics. The 2D image in the center shows the magnification map in the source plane and the straight line marks the trajectory of the background star across the field of microcaustics.
Current usage metrics show cumulative count of Article Views (full-text article views including HTML views, PDF and ePub downloads, according to the available data) and Abstracts Views on Vision4Press platform.
Data correspond to usage on the plateform after 2015. The current usage metrics is available 48-96 hours after online publication and is updated daily on week days.
Initial download of the metrics may take a while.