Fig. 2
Download original image
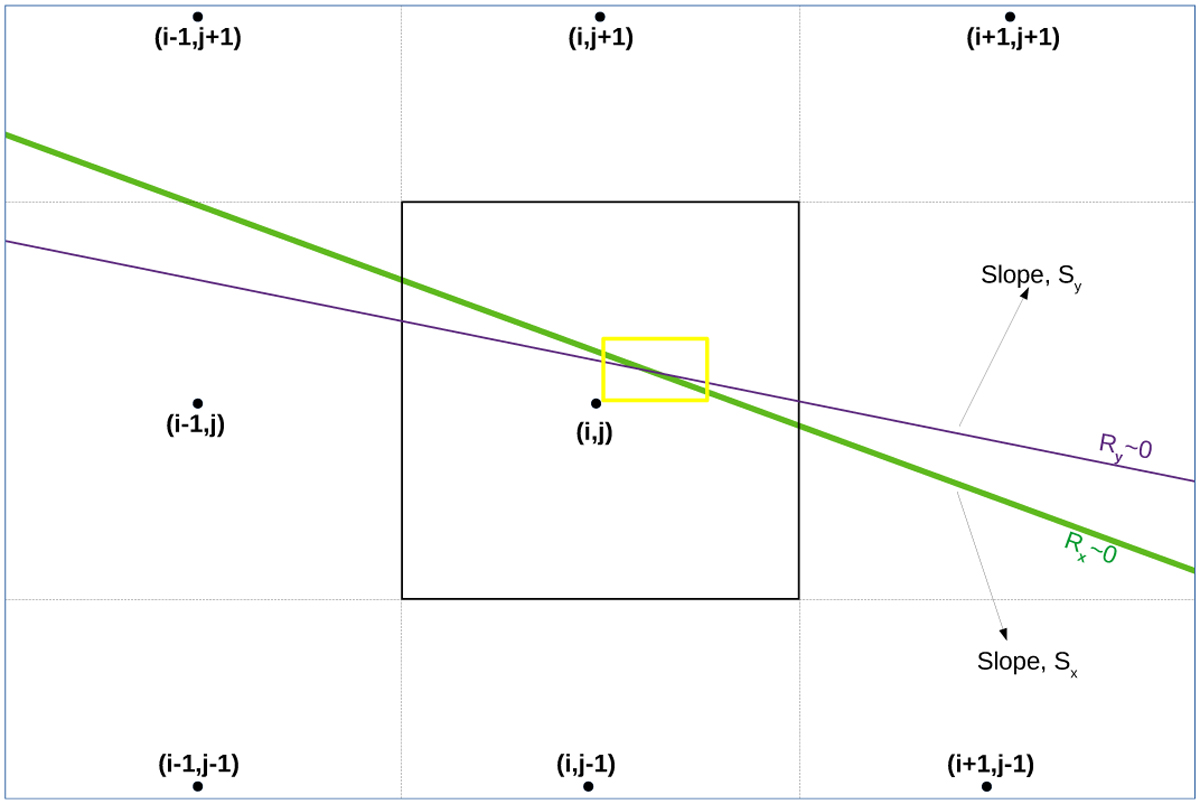
Representation of Rx and Ry at the subpixel area. The squares represent the pixel size. The pixel at position (i, j), and containing a microimage is marked with thicker solid black lines in the center. Neighboring pixels are marked with dashed lines. The residual Ry and Rx are marked with blue and green lines, respectively. The yellow rectangle is the region represented in greater detail in Fig. 3.
Current usage metrics show cumulative count of Article Views (full-text article views including HTML views, PDF and ePub downloads, according to the available data) and Abstracts Views on Vision4Press platform.
Data correspond to usage on the plateform after 2015. The current usage metrics is available 48-96 hours after online publication and is updated daily on week days.
Initial download of the metrics may take a while.