Fig. 1
Download original image
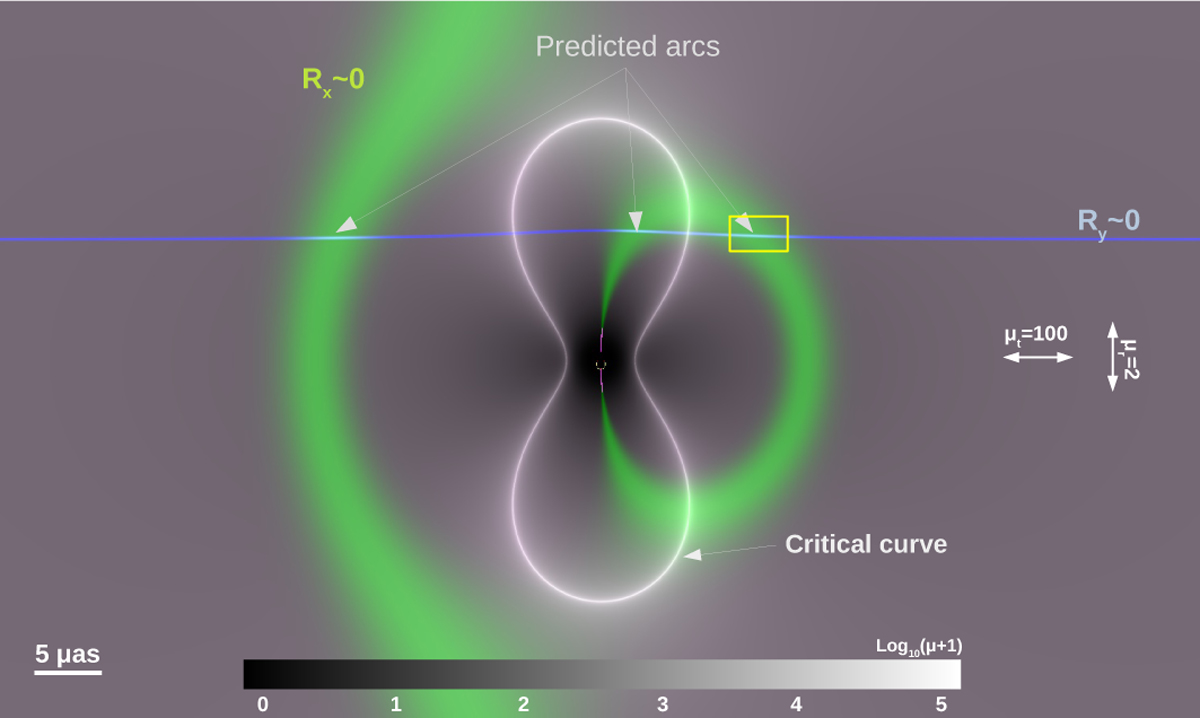
Magnification map around a 1 M⊙ embedded in a macrolens potential with magnification µt = 100 and µr = 2. The gray scale shows the magnification with the critical curve around the microlens forming a standing hourglass figure. The blue, almost horizontal, thin curve marks the region where the residual Ry ~ 0. The wide green curve marks the corresponding region where the residual Rx ~ 0. Arcs form in regions where both blue and green curves overlap, that is, when the condition in Eq. (3) is satisfied. The yellow rectangle encloses a small region shown in the cartoon representation of Fig. 2. The gray scale shows the logarithm of the magnification. The direction of the tangential and radial components of the magnification are marked in the horizontal and vertical direction respectively.
Current usage metrics show cumulative count of Article Views (full-text article views including HTML views, PDF and ePub downloads, according to the available data) and Abstracts Views on Vision4Press platform.
Data correspond to usage on the plateform after 2015. The current usage metrics is available 48-96 hours after online publication and is updated daily on week days.
Initial download of the metrics may take a while.