Fig. 8.
Download original image
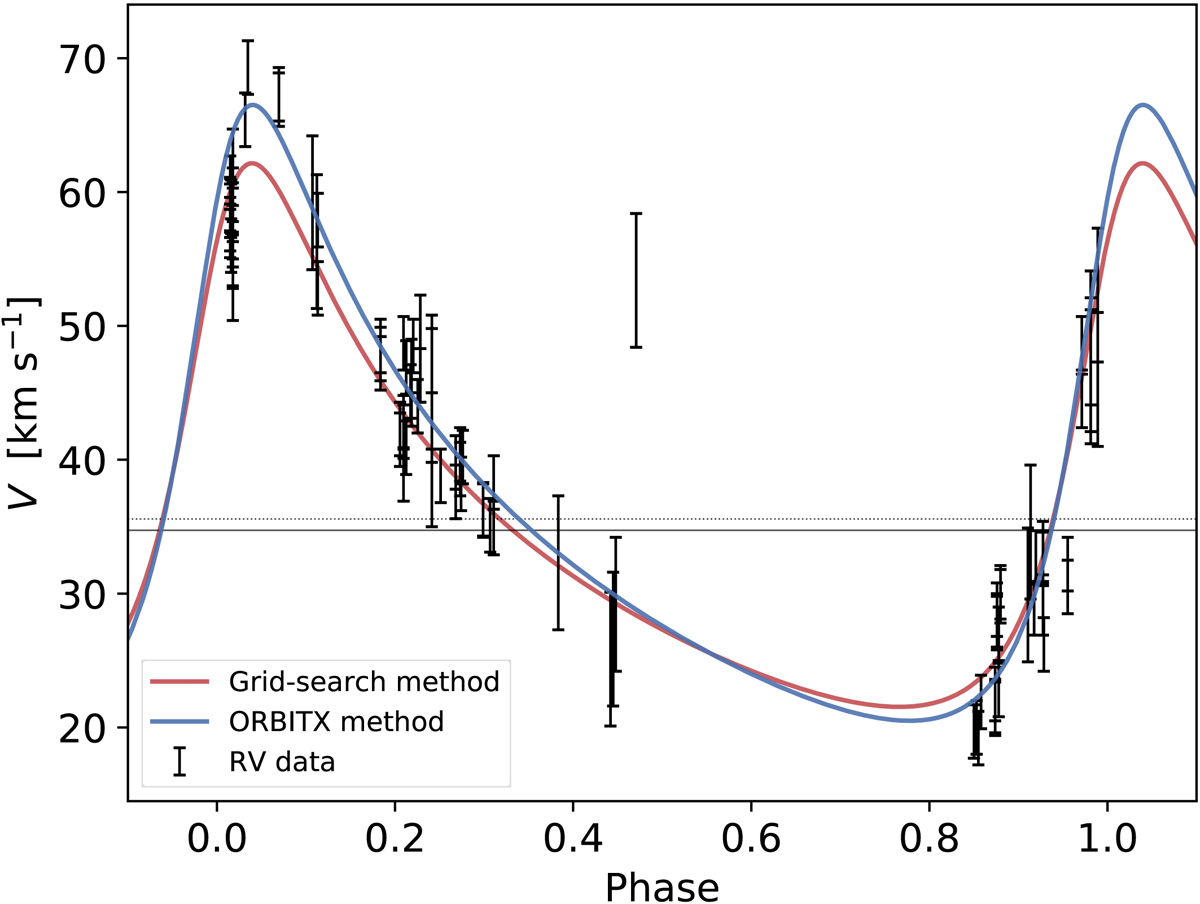
Radial velocity measurements of MWC 166 A taken in the period 1994–2005 plotted against orbital phase. The blue and red fitted curves correspond to the orbits specified in Cols. (3) and (4) of Table 4, respectively. The dotted black line shows the velocity of the system’s centre of mass (V0) for the grid-search method, and the solid grey line shows V0 for the ORBITX orbit.
Current usage metrics show cumulative count of Article Views (full-text article views including HTML views, PDF and ePub downloads, according to the available data) and Abstracts Views on Vision4Press platform.
Data correspond to usage on the plateform after 2015. The current usage metrics is available 48-96 hours after online publication and is updated daily on week days.
Initial download of the metrics may take a while.