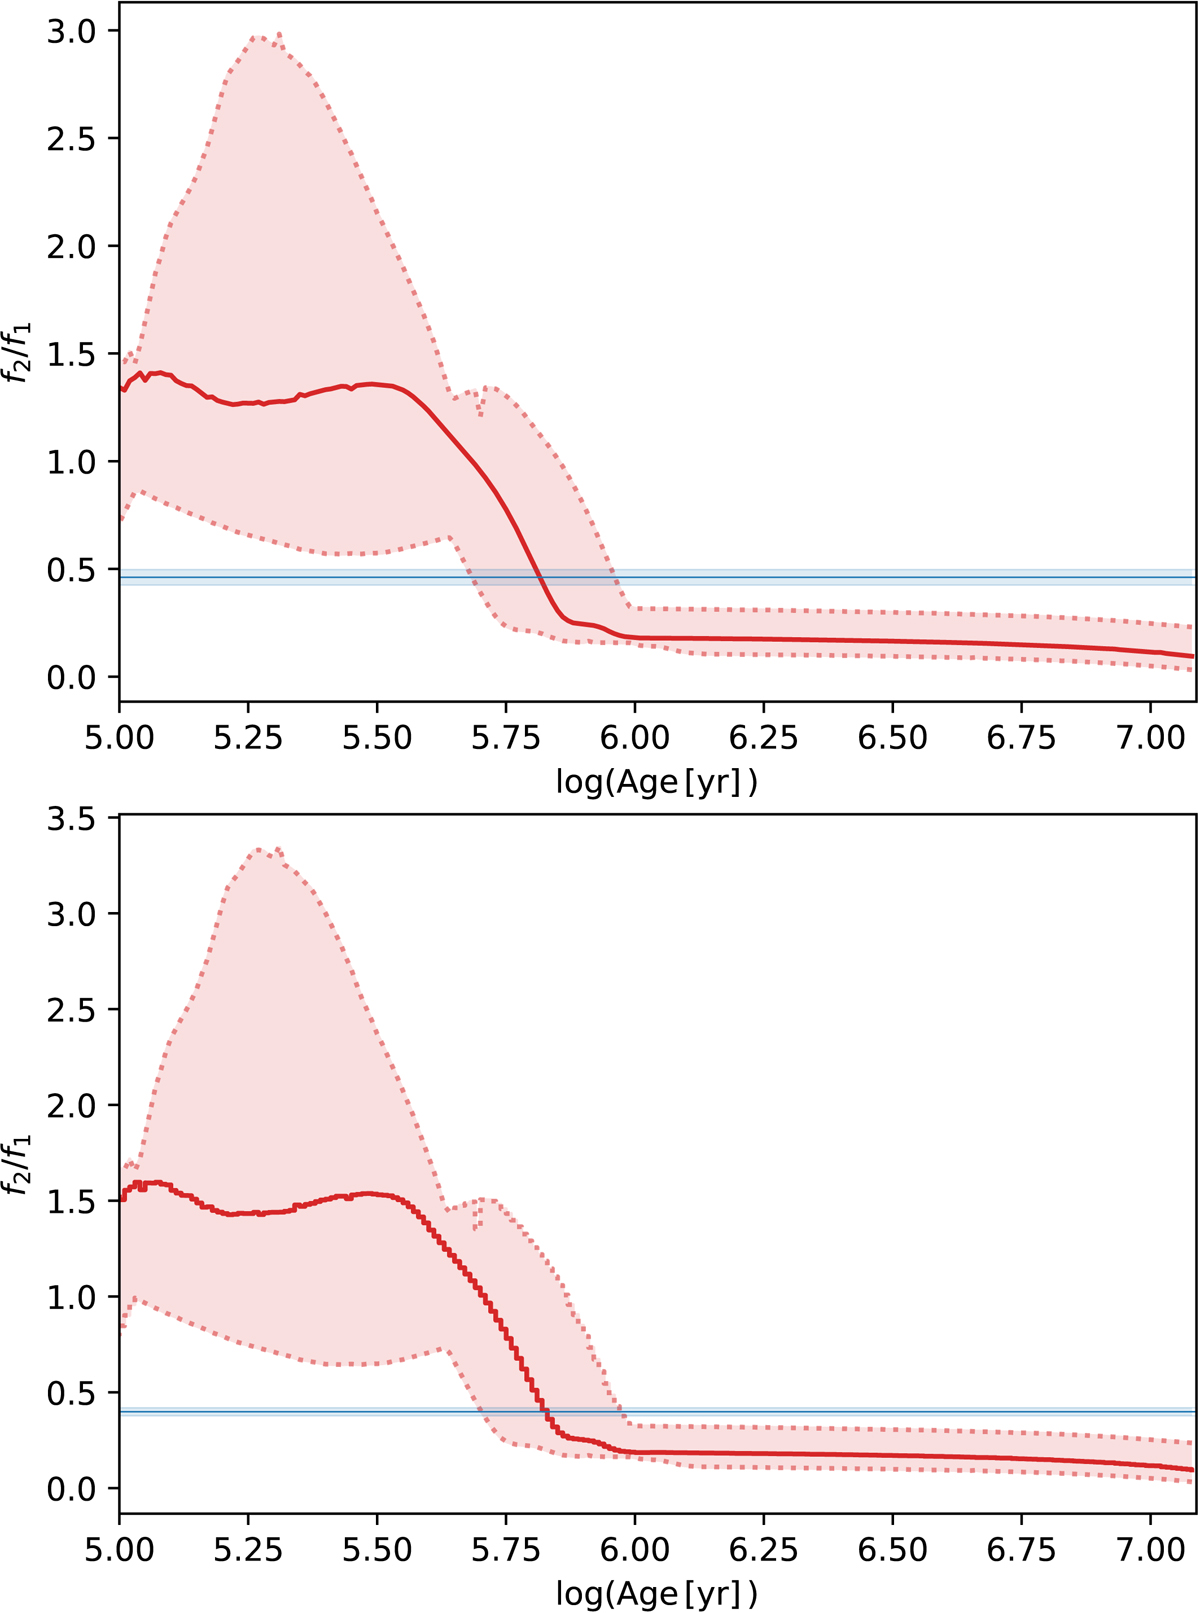
Fig. 11.
Download original image
Flux ratio f2/f1 plotted against log(Age), for all isochrones (red lines), compared to interferometric flux ratios at the same wavelength (blue lines). The upper panel shows the flux ratio at 1.65 μm, while the lower panel shows the flux ratio at 2.2 μm – the central wavelengths for the H and K bands, respectively. The lighter-shaded areas illustrate the uncertainty on each quantity.
Current usage metrics show cumulative count of Article Views (full-text article views including HTML views, PDF and ePub downloads, according to the available data) and Abstracts Views on Vision4Press platform.
Data correspond to usage on the plateform after 2015. The current usage metrics is available 48-96 hours after online publication and is updated daily on week days.
Initial download of the metrics may take a while.