Fig. 10.
Download original image
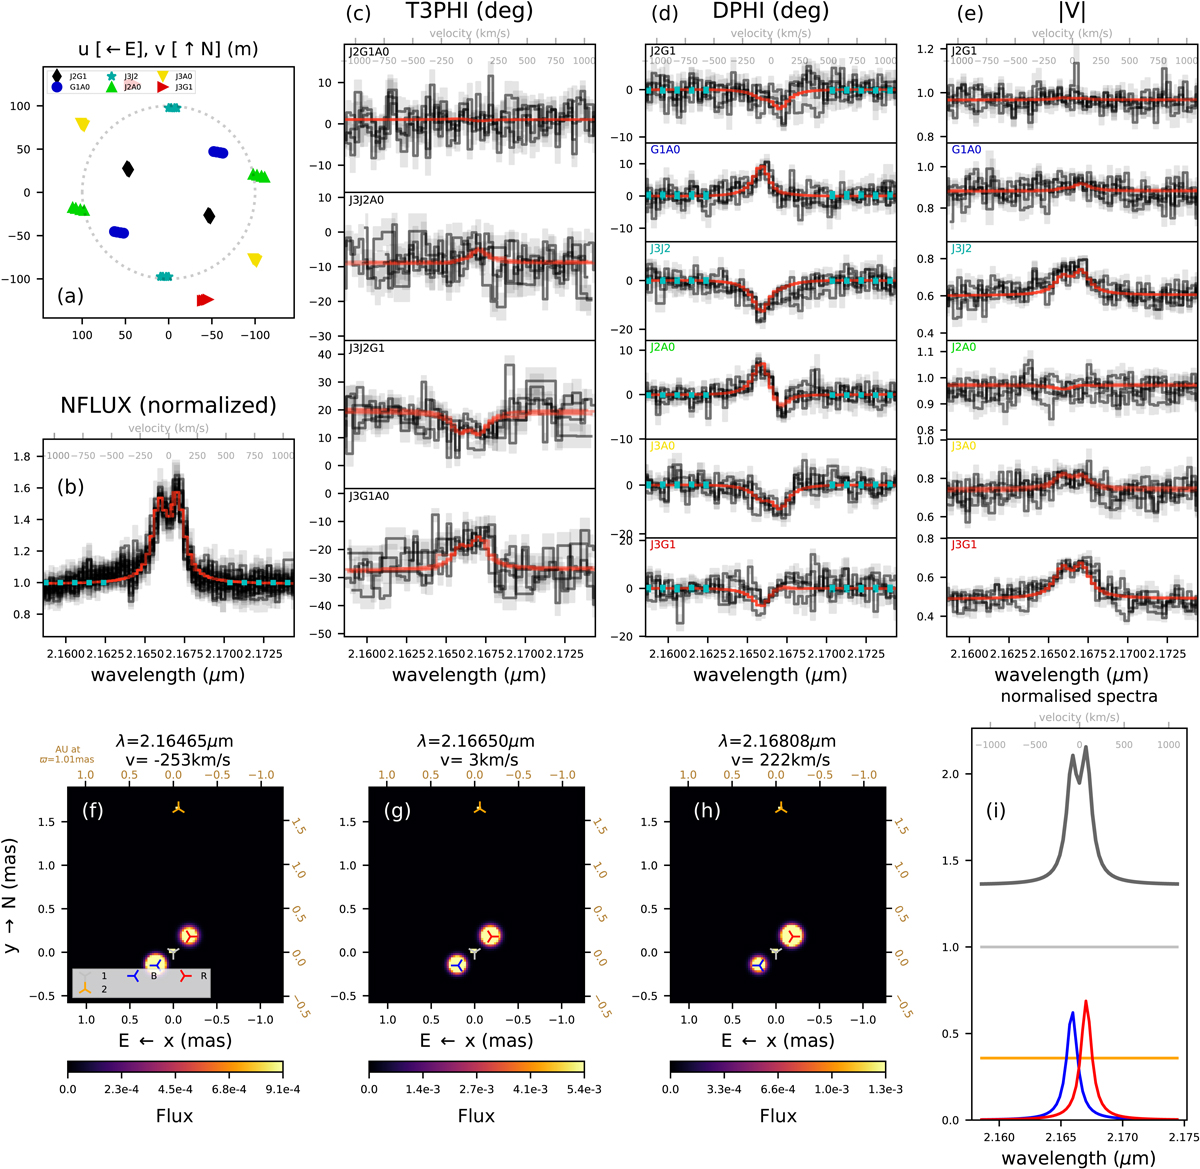
Results of the Br γ line modelling, for the epoch 14 March 2017. (a): (u, v)-coverage for the observations associated with the epoch, coloured by baseline pair. (b): telluric-corrected normalised flux (labelled NFLUX, black lines), overplotted with flux in the best-fit model (red line). (c)–(e): data from each GRAVITY exposure (black lines), overplotted with quantities computed from best-fit model (red lines). The observables are closure phase for each telescope triplet (T3PHI), differential phase for each baseline (DPHI), and visibility for each baseline (|V|), respectively. (f)–(h): brightness distribution corresponding to the best fit, for three representative wavelengths. (i): synthetic line strengths and profiles for the two spectral components in the model (red and blue), in addition to the monochromatic continuum flux associated with the primary component (silver) and the secondary component (gold). The parameters corresponding to the fits can be found in Table 6.
Current usage metrics show cumulative count of Article Views (full-text article views including HTML views, PDF and ePub downloads, according to the available data) and Abstracts Views on Vision4Press platform.
Data correspond to usage on the plateform after 2015. The current usage metrics is available 48-96 hours after online publication and is updated daily on week days.
Initial download of the metrics may take a while.