Fig. 7.
Download original image
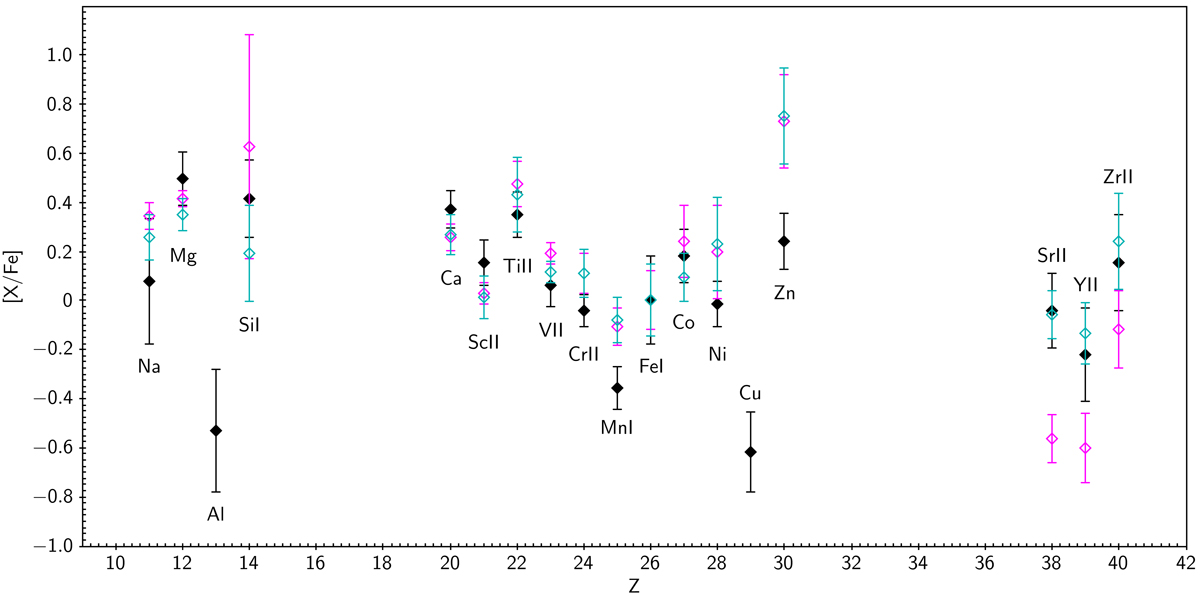
Elemental abundance ratios versus atomic number, Z, for stars in the sample with −3.1 < [Fe/H] < −2.4. Coloured symbols indicate abundance patterns for stars CES1543+0201 (magenta) and CES2254-4209 (cyan) with errors. Black symbols indicate the average abundance ratios of Zn-normal stars. Black error bars represent the standard deviation around the mean abundance. Abundance ratios of neutral and ionised species are scaled to their Fe counterpart.
Current usage metrics show cumulative count of Article Views (full-text article views including HTML views, PDF and ePub downloads, according to the available data) and Abstracts Views on Vision4Press platform.
Data correspond to usage on the plateform after 2015. The current usage metrics is available 48-96 hours after online publication and is updated daily on week days.
Initial download of the metrics may take a while.