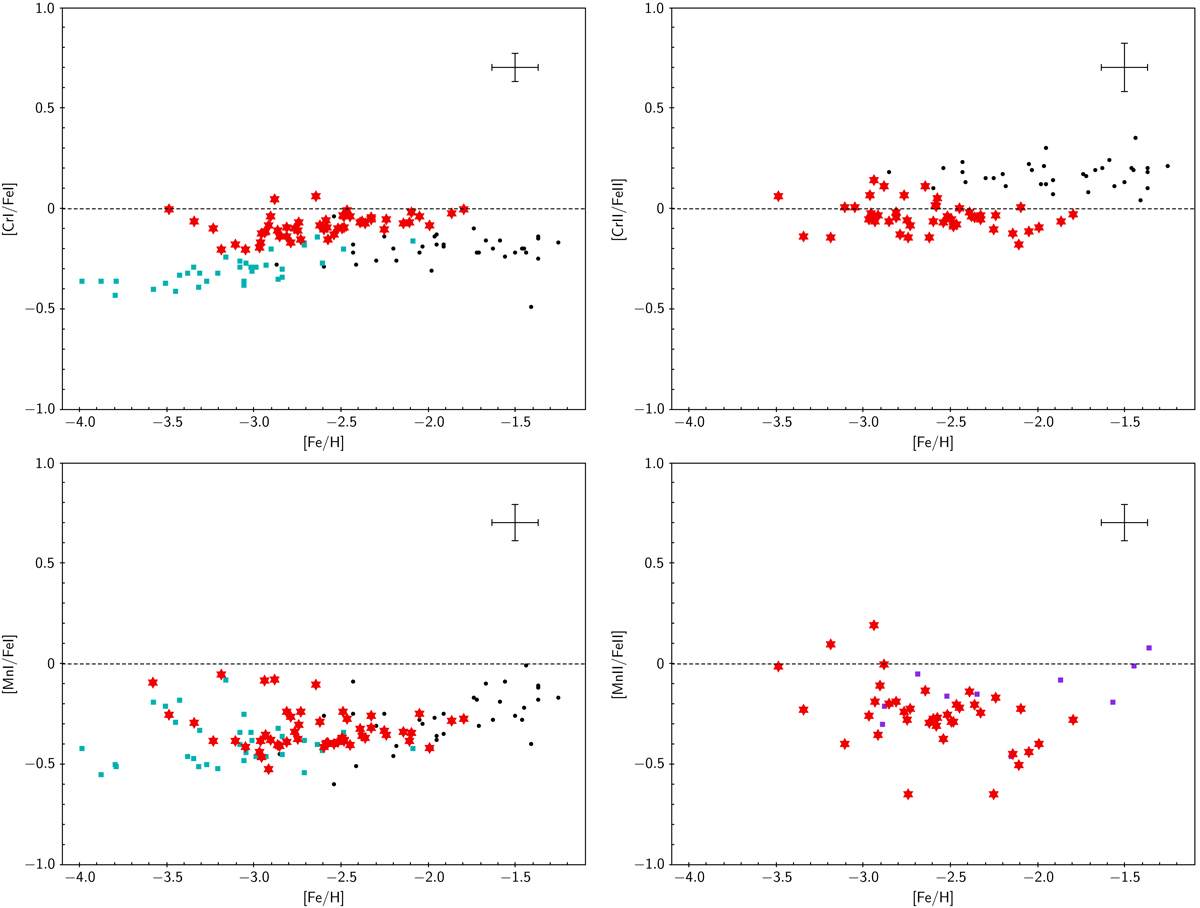
Fig. 5.
Download original image
Elemental abundance ratios of Cr and Mn as a function of [Fe/H] for stars in our sample (red star symbols). Cyan squares and black dots are from Cayrel et al. (2004) and Ishigaki et al. (2013), respectively. Purple squares represent NLTE [Mn/Fe] abundance ratios for stars in Eitner et al. (2020). A representative error is plotted in the upper-right corner of each panel.
Current usage metrics show cumulative count of Article Views (full-text article views including HTML views, PDF and ePub downloads, according to the available data) and Abstracts Views on Vision4Press platform.
Data correspond to usage on the plateform after 2015. The current usage metrics is available 48-96 hours after online publication and is updated daily on week days.
Initial download of the metrics may take a while.