Open Access
Fig. 3.
Download original image
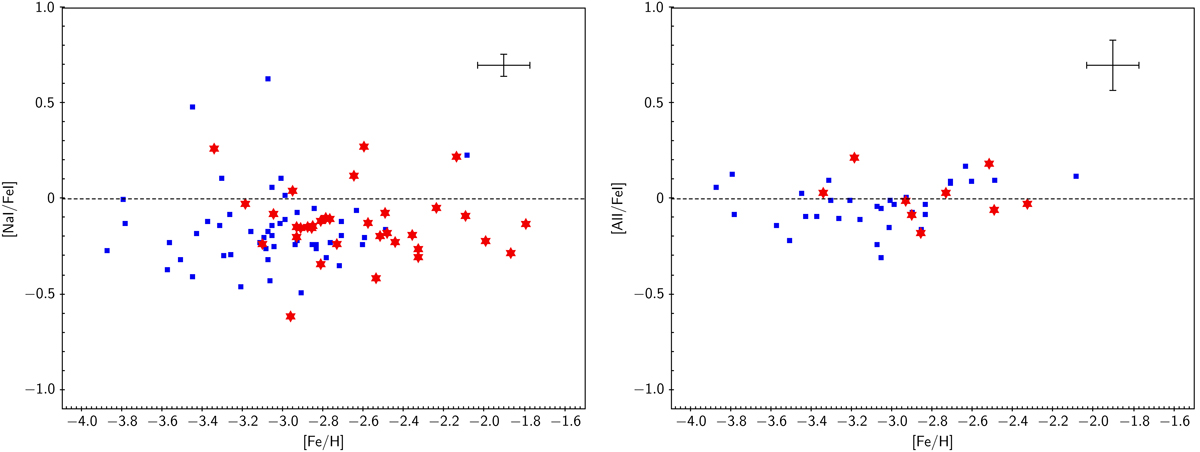
NLTE abundance ratios of Na and Al as a function of [Fe/H] for stars in our sample (red star symbols). Blue squares are stars from Andrievsky et al. (2007, 2008) for Na and Al, respectively. A representative error is plotted in the upper-right corner.
Current usage metrics show cumulative count of Article Views (full-text article views including HTML views, PDF and ePub downloads, according to the available data) and Abstracts Views on Vision4Press platform.
Data correspond to usage on the plateform after 2015. The current usage metrics is available 48-96 hours after online publication and is updated daily on week days.
Initial download of the metrics may take a while.