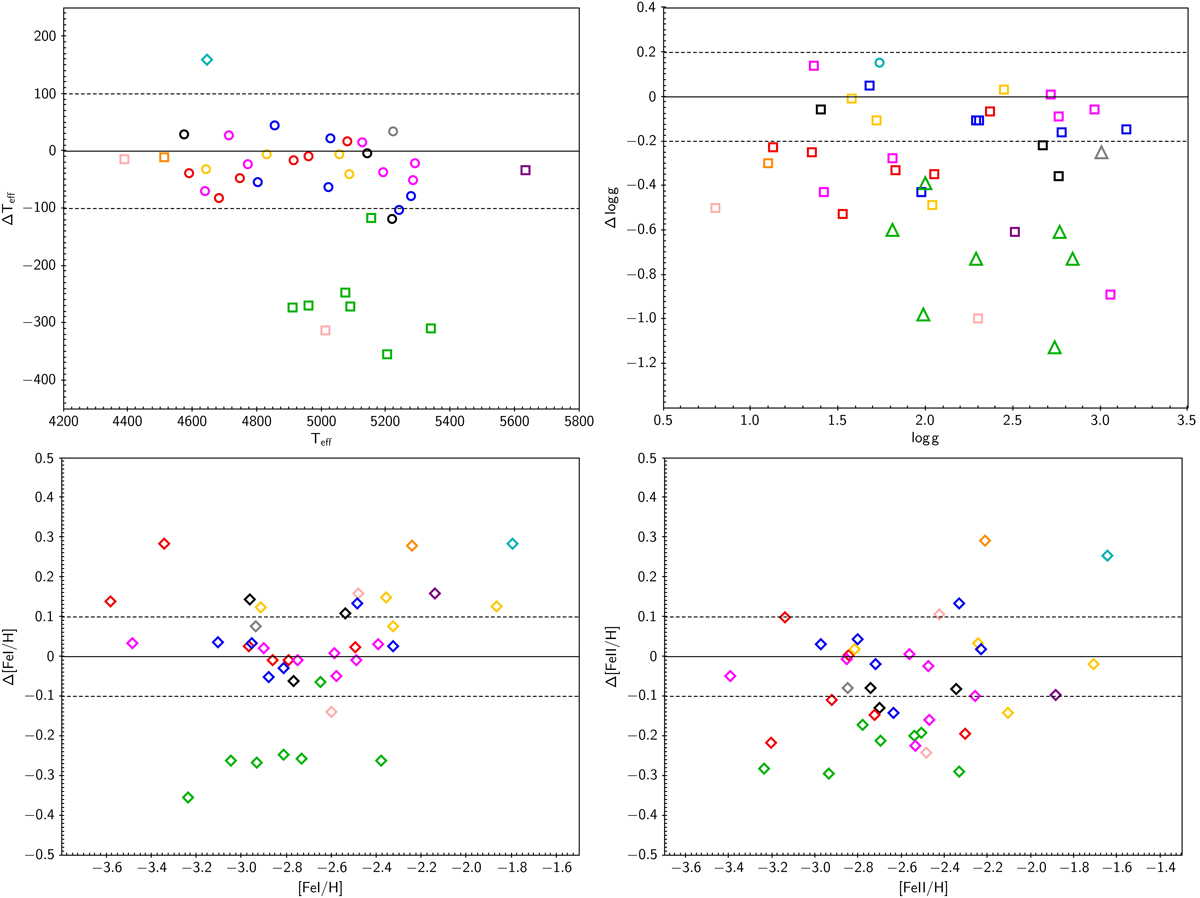
Fig. 1.
Download original image
Comparison between this work and the literature: Teff (upper-left panel), log g (upper-right panel), Fe I (lower-left panel), and Fe II (lower-right panel). Open circles denote Teff and log g derived from photometry, open squares denote the same derived from spectroscopy, and open triangles indicate log g derived from theoretical isochrones. Data are from Barklem et al. (2005) (black), Cayrel et al. (2004) (red), Hansen et al. (2020) (cyan), Ishigaki et al. (2012) (yellow), Johnson (2002) (pink), Lai et al. (2008) (grey), Luck & Bond (1985) (orange), Mashonkina et al. (2017b) (blue), Pereira et al. (2013) (purple), Roederer et al. (2014a) (green), and Siqueira Mello et al. (2014) (magenta).
Current usage metrics show cumulative count of Article Views (full-text article views including HTML views, PDF and ePub downloads, according to the available data) and Abstracts Views on Vision4Press platform.
Data correspond to usage on the plateform after 2015. The current usage metrics is available 48-96 hours after online publication and is updated daily on week days.
Initial download of the metrics may take a while.