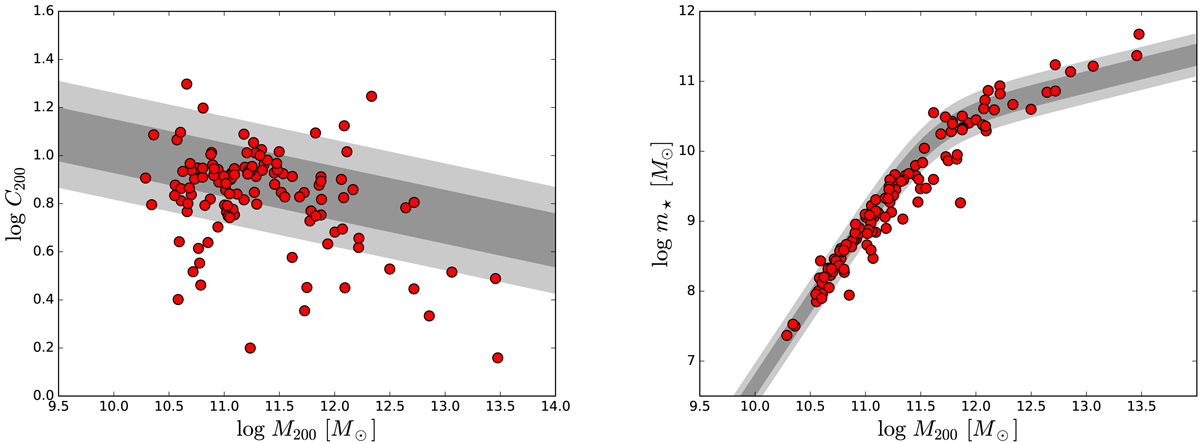
Fig. 4.
Download original image
ΛCDM priors: the halo mass–concentration relation (left panel) from DM-only simulations (Dutton & Macciò 2014) and the stellar-to-halo mass relation (right panel) from abundance matching (Moster et al. 2013). In both panels, red circles show the best-fit halo masses and concentrations of the initial NFW halos. Dark and light gray bands show the expected 1σ and 2σ regions, respectively. Both relations are imposed as priors in fitting rotation curves. Our results show larger scatters than the simulation predictions.
Current usage metrics show cumulative count of Article Views (full-text article views including HTML views, PDF and ePub downloads, according to the available data) and Abstracts Views on Vision4Press platform.
Data correspond to usage on the plateform after 2015. The current usage metrics is available 48-96 hours after online publication and is updated daily on week days.
Initial download of the metrics may take a while.