Fig. C.1
Download original image
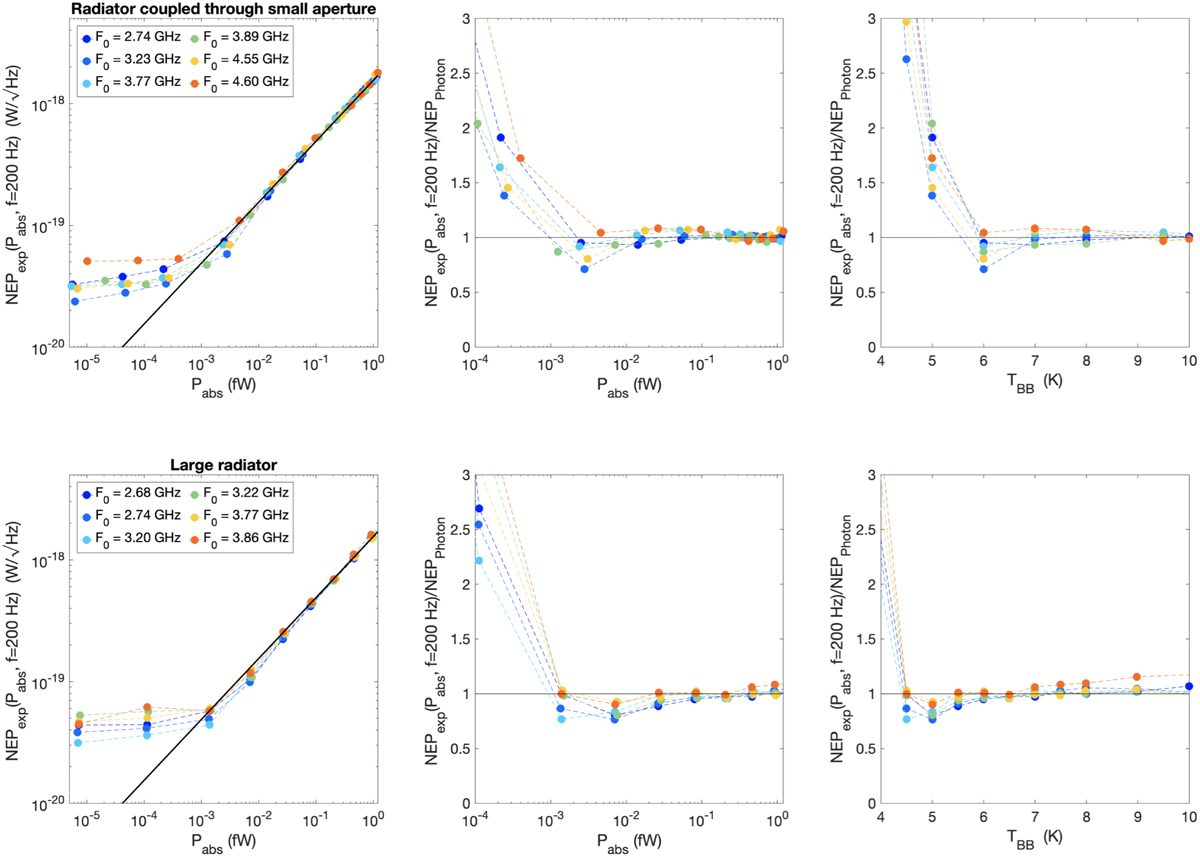
NEP as function of absorbed power for all measured devices. Top row: Data of all measured MKIDs using radiation coupling via a small pinhole to the small radiator source. The left figure gives the data for all KIDs identical to Fig3.e in the main text. The centre and right plots give the NEP divided by the photon noise limit, showing more clearly that the measured NEP can be below the photon noise limit for 10 aW < Pabs < 100 aW. Bottom row: Similar data, but now using the large radiator coupled without pinhole to the detector chip. We observe that the region where the experimental NEP is below the photon noise limit scales with Pabs, and not with radiator temperature.
Current usage metrics show cumulative count of Article Views (full-text article views including HTML views, PDF and ePub downloads, according to the available data) and Abstracts Views on Vision4Press platform.
Data correspond to usage on the plateform after 2015. The current usage metrics is available 48-96 hours after online publication and is updated daily on week days.
Initial download of the metrics may take a while.