Fig. 4
Download original image
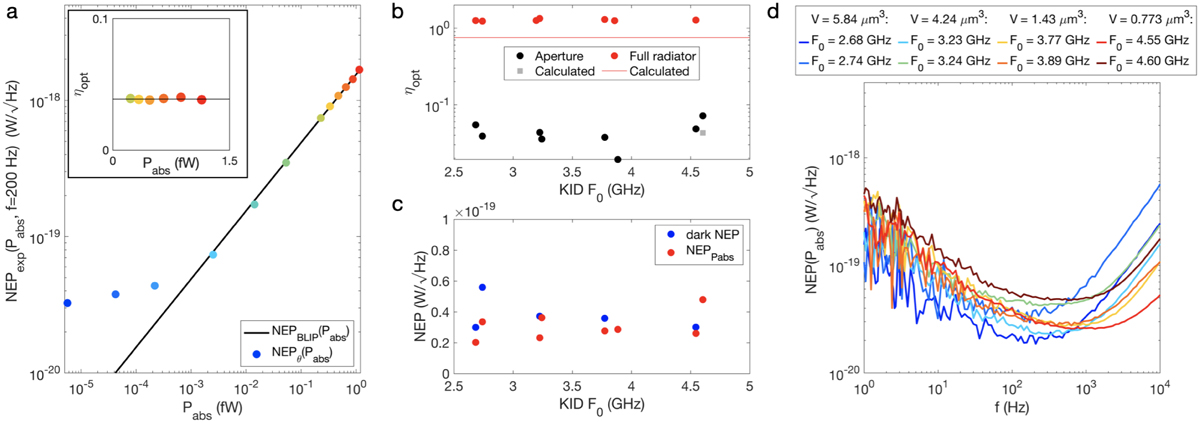
NEP and coupling efficiency. (a) The NEP at f = 200 Hz (see panel d), as function of absorbed power using the pinhole setup for the same device as in Fig. 3. The black line shows the theoretical curve. The absorbed power is evaluated from the source power using the measured efficiency as indicated in the insert, and the mean value of the points, ηopt = 0.0389 ± 0.004, is given by the line. The statistical error bars are smaller than the dots. (b) The averaged coupling efficiencies for the two experiments. The red dots represent the results for the large radiator, where all detectors couple almost identically to the source as expected; the calculated coupling is given by the line. The black dots give the coupling for the pinhole setup, where only the best aligned detector is expected to reach the theoretical coupling value given by the grey square. We note that, in both cases, the measured coupling exceeds the theoretical value by the same factor of ~1.65. (c) The measured NEPexp(Pabs, f = 200 Hz) for the pinhole experiment, as displayed in Fig. 2c, together with the dark NEP obtained at the same modulation frequency using a change in bath temperature to obtain the response. (d) The measured NEPexp(Pabs, f) for the pinhole experiment at the lowest radiator temperature for all measured MKIDs. We observe no dependence of the NEP on aluminium volume. We note that panel a and Fig. 3 are given for the detector with F0 = 2.74 GHz.
Current usage metrics show cumulative count of Article Views (full-text article views including HTML views, PDF and ePub downloads, according to the available data) and Abstracts Views on Vision4Press platform.
Data correspond to usage on the plateform after 2015. The current usage metrics is available 48-96 hours after online publication and is updated daily on week days.
Initial download of the metrics may take a while.