Fig. 3
Download original image
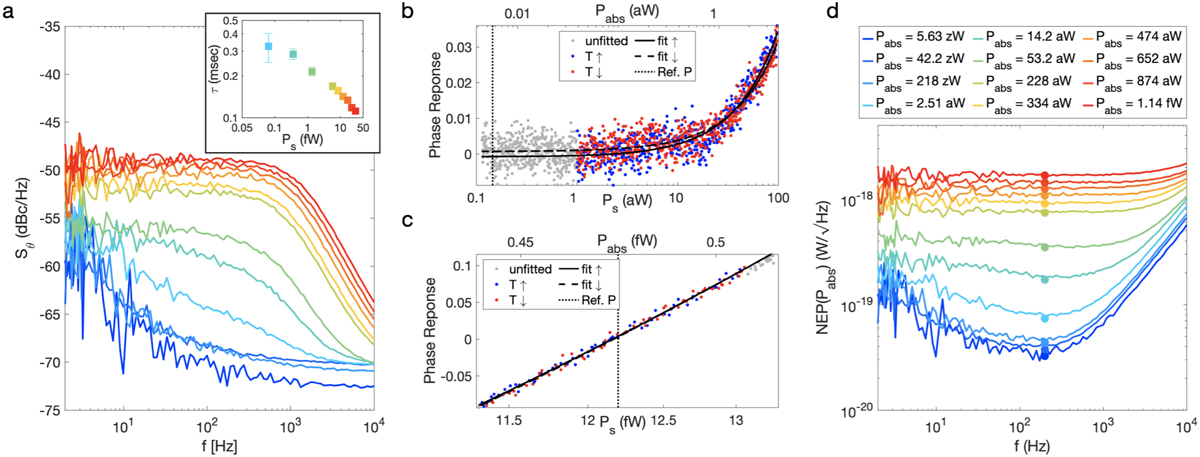
Noise, response and NEP for a single detector. (a) Measured phase noise power spectral density for several source powers, increasing from bottom to top. There is a clear transition from detector-limited noise (lower curves) to photon-noise-limited noise, characterised by a white spectrum rolled-off with ![]() (highest curves). The insert shows the
(highest curves). The insert shows the ![]() for the same source powers. (b) KID phase response around the lowest source power used to obtain the NEP, Ps = 0.145 aW (Pabs = 5.63 zW), which corresponds to a radiator temperature of 4 K. The data represent a measurement obtained by sweeping the radiator temperature from 3.95 to 6.21 K and back to 3.95 K. The data is plotted on a semi-logarithmic scale to show the absence of any response at low powers. The fits and fitted range are indicated as well. (c) MKID response and fits for increasing and decreasing radiator temperature around a higher source power, Ps = 12.2 fW. We indicate the source power as well as the absorbed power in panels b and c for convenience. (d) Measured NEP for the same set of powers, now expressed in power absorbed in the detector. The legend is also valid for panel a.
for the same source powers. (b) KID phase response around the lowest source power used to obtain the NEP, Ps = 0.145 aW (Pabs = 5.63 zW), which corresponds to a radiator temperature of 4 K. The data represent a measurement obtained by sweeping the radiator temperature from 3.95 to 6.21 K and back to 3.95 K. The data is plotted on a semi-logarithmic scale to show the absence of any response at low powers. The fits and fitted range are indicated as well. (c) MKID response and fits for increasing and decreasing radiator temperature around a higher source power, Ps = 12.2 fW. We indicate the source power as well as the absorbed power in panels b and c for convenience. (d) Measured NEP for the same set of powers, now expressed in power absorbed in the detector. The legend is also valid for panel a.
Current usage metrics show cumulative count of Article Views (full-text article views including HTML views, PDF and ePub downloads, according to the available data) and Abstracts Views on Vision4Press platform.
Data correspond to usage on the plateform after 2015. The current usage metrics is available 48-96 hours after online publication and is updated daily on week days.
Initial download of the metrics may take a while.