Fig. 3.
Download original image
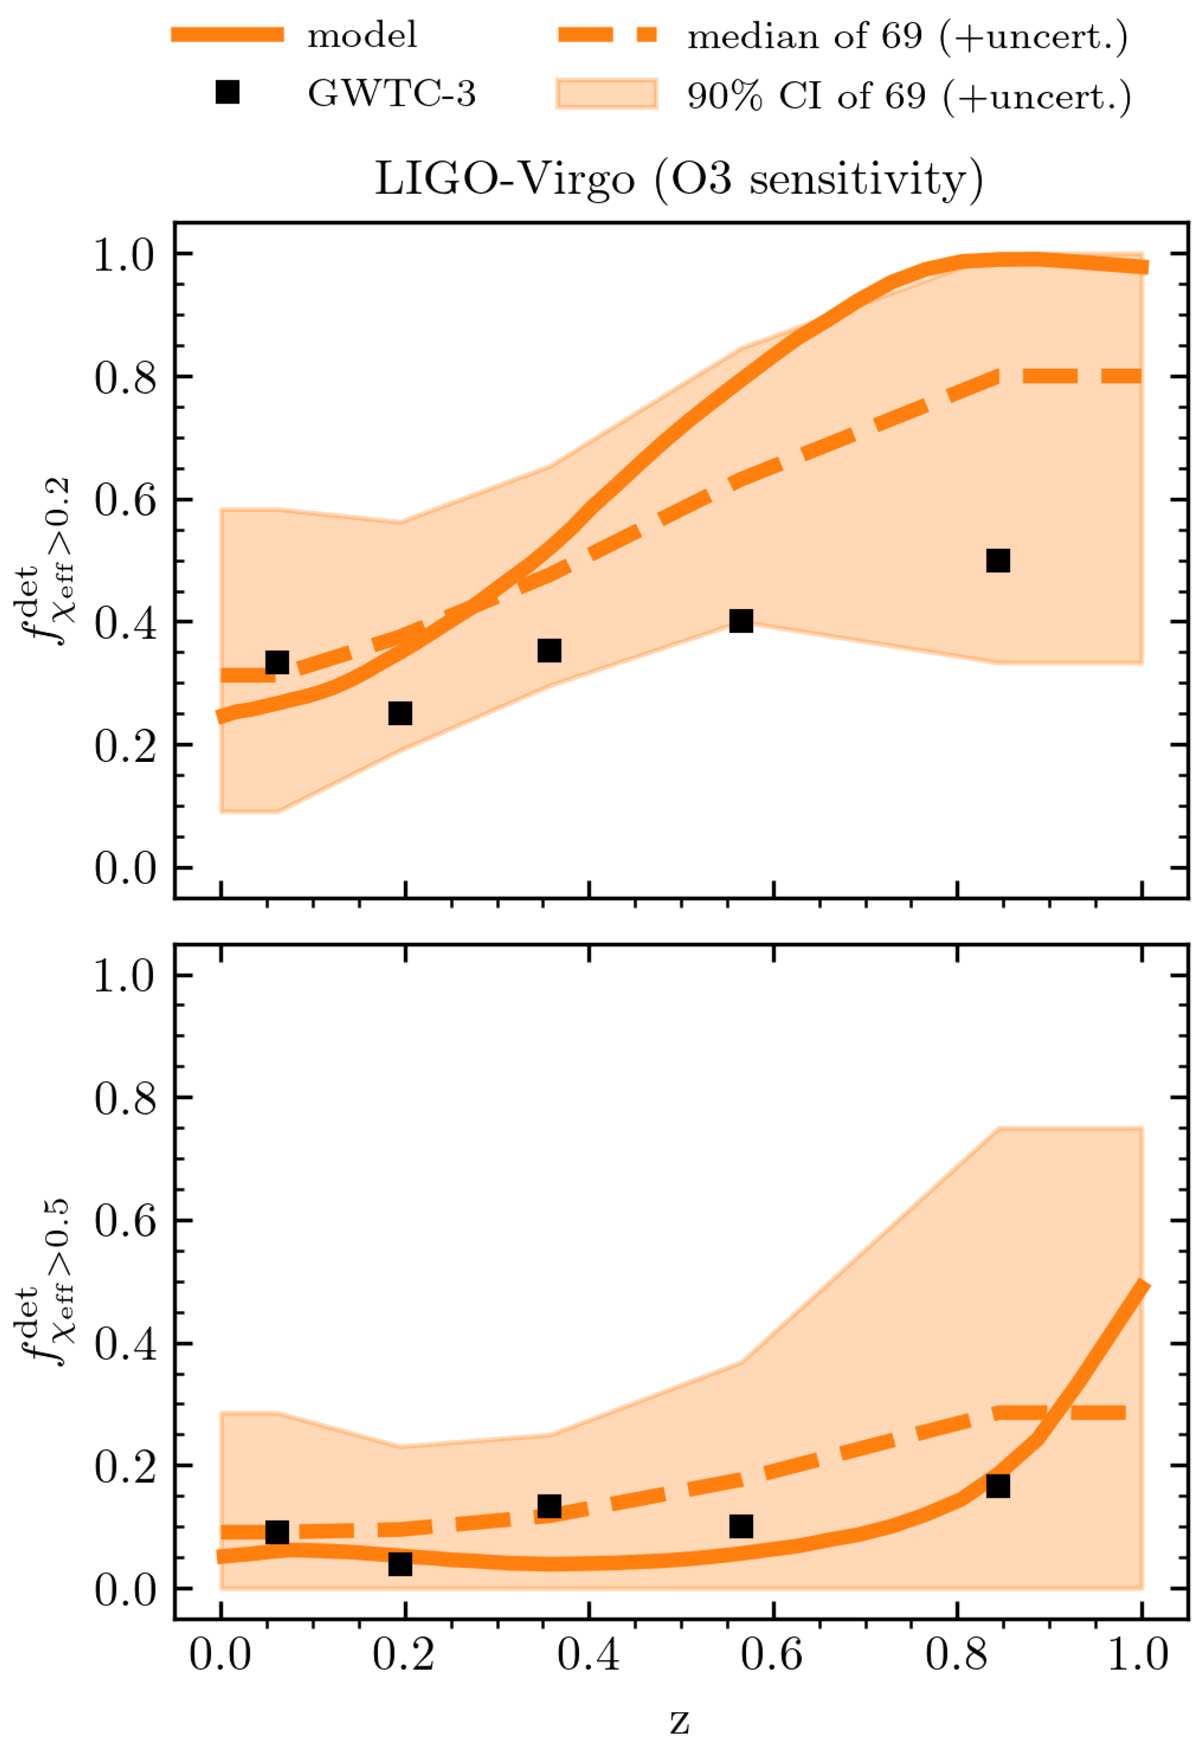
Modeled and observed fractions of BBHs satisfying ![]() as a function of the redshift. Samples are placed into redshift bins with a bin size of Δt = 1.6 Gyr. The observed fractions
as a function of the redshift. Samples are placed into redshift bins with a bin size of Δt = 1.6 Gyr. The observed fractions ![]() and
and ![]() are obtained from the median of 10 000 GWTC-3 mock catalog events obtained by sampling the 69 events with FAR < 1 yr−1 likelihoods. The modeled prediction for O3 sensitivity is shown with a solid orange line. To compare the model with the data, we generated 10 000 mock catalogs of 69 events, to which we added mock measurements uncertainties. We indicate the median and 90% CI modeled fractions with orange dashed line and shaded area, respectively. Mock uncertainties are obtained from the zero-centered GWTC-3 event likelihoods.
are obtained from the median of 10 000 GWTC-3 mock catalog events obtained by sampling the 69 events with FAR < 1 yr−1 likelihoods. The modeled prediction for O3 sensitivity is shown with a solid orange line. To compare the model with the data, we generated 10 000 mock catalogs of 69 events, to which we added mock measurements uncertainties. We indicate the median and 90% CI modeled fractions with orange dashed line and shaded area, respectively. Mock uncertainties are obtained from the zero-centered GWTC-3 event likelihoods.
Current usage metrics show cumulative count of Article Views (full-text article views including HTML views, PDF and ePub downloads, according to the available data) and Abstracts Views on Vision4Press platform.
Data correspond to usage on the plateform after 2015. The current usage metrics is available 48-96 hours after online publication and is updated daily on week days.
Initial download of the metrics may take a while.