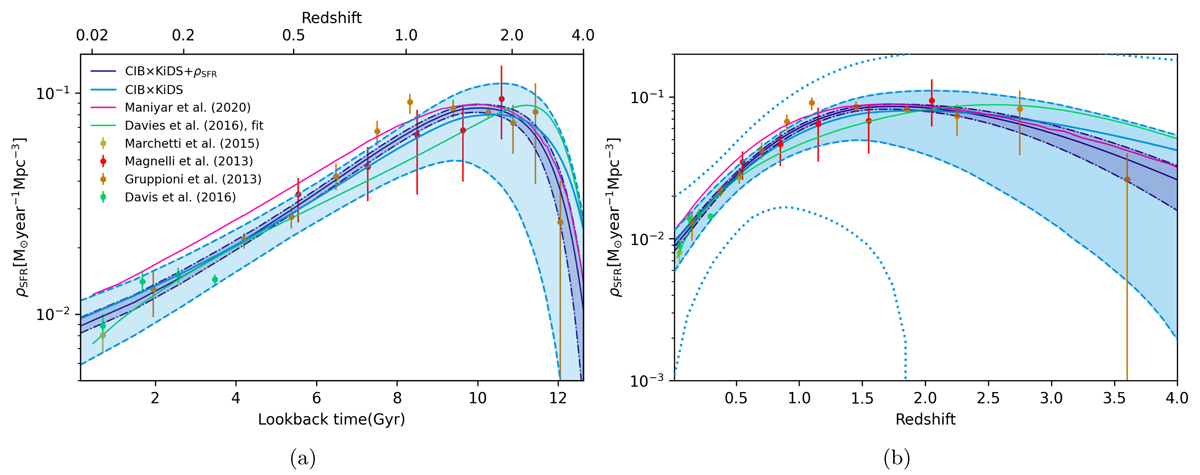
Fig. 9.
Download original image
Evolution of the SFRD with respect to lookback time (panel a) and redshift (panel b). The SFRD calculated from this work is presented as cyan (cross-correlation only) and dark blue (cross-correlation plus external SFRD) lines and shaded regions. The shaded regions enclose the 1σ credible region of the fits and are calculated from 10 000 realisations of SFR parameters from the posterior distribution. The 3σ credible region of the cross-correlation-only SFRD is also shown in panel b with dotted cyan lines. We note that the lower 3σ limit crosses zero at z ∼ 1.8. The magenta and green lines are the best-fit SFRD from two previous studies, and the points with error bars are the SFRD from previous studies (which are included in our CIB × KiDS + ρSFR analysis).
Current usage metrics show cumulative count of Article Views (full-text article views including HTML views, PDF and ePub downloads, according to the available data) and Abstracts Views on Vision4Press platform.
Data correspond to usage on the plateform after 2015. The current usage metrics is available 48-96 hours after online publication and is updated daily on week days.
Initial download of the metrics may take a while.