Fig. 7.
Download original image
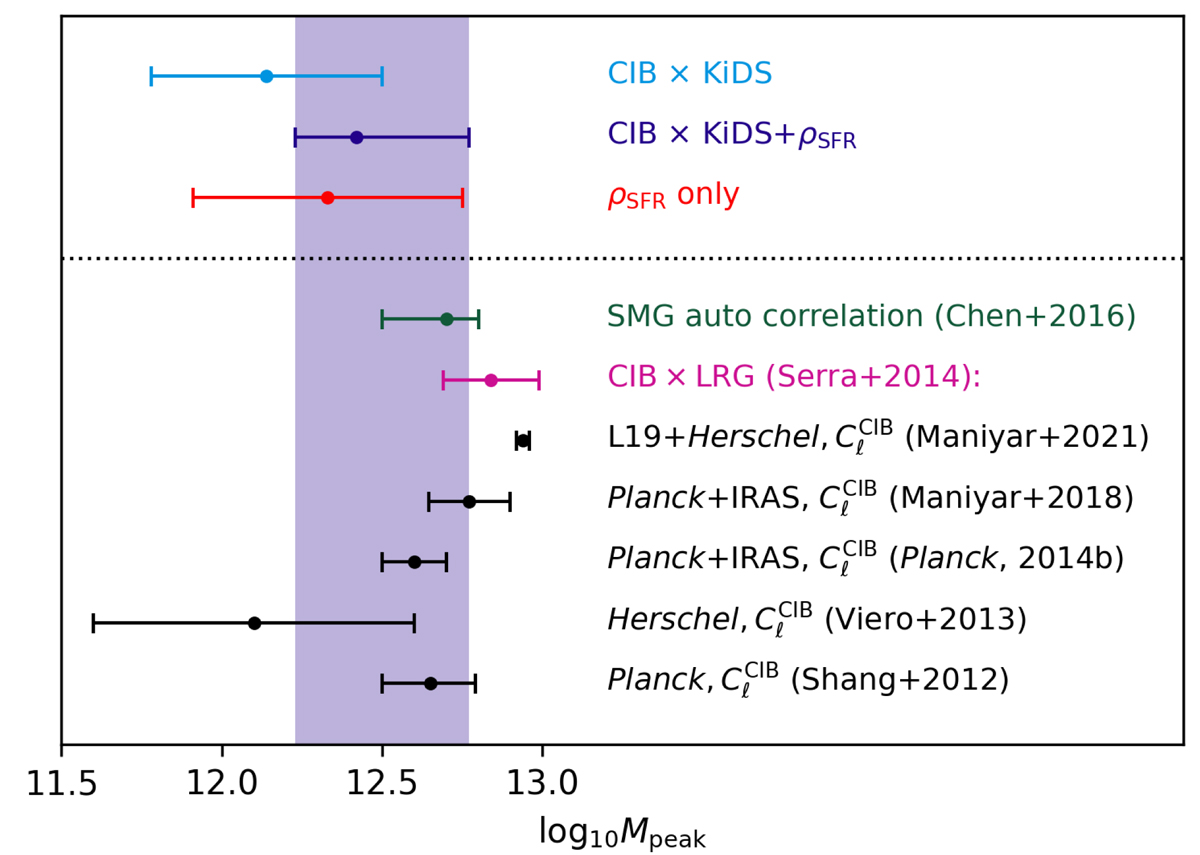
Comparison of our constraints on Mpeak with a number of recent results from the literature. The three points above the dotted line are the results from this work. The other points are colour-coded according to their methods: the green point shows the result from SMG auto-correlations (Chen et al. 2016), the magenta shows the measurements using LRG-CIB cross-correlations (Serra et al. 2014), and the black points show measurements using CIB power spectra (Shang et al. 2012; Viero et al. 2013; Planck Collaboration XXX 2014; Maniyar et al. 2018, 2021). The dark blue band shows the 68% credible interval of our CIB × KiDS + ρSFR marginal posterior constraint.
Current usage metrics show cumulative count of Article Views (full-text article views including HTML views, PDF and ePub downloads, according to the available data) and Abstracts Views on Vision4Press platform.
Data correspond to usage on the plateform after 2015. The current usage metrics is available 48-96 hours after online publication and is updated daily on week days.
Initial download of the metrics may take a while.