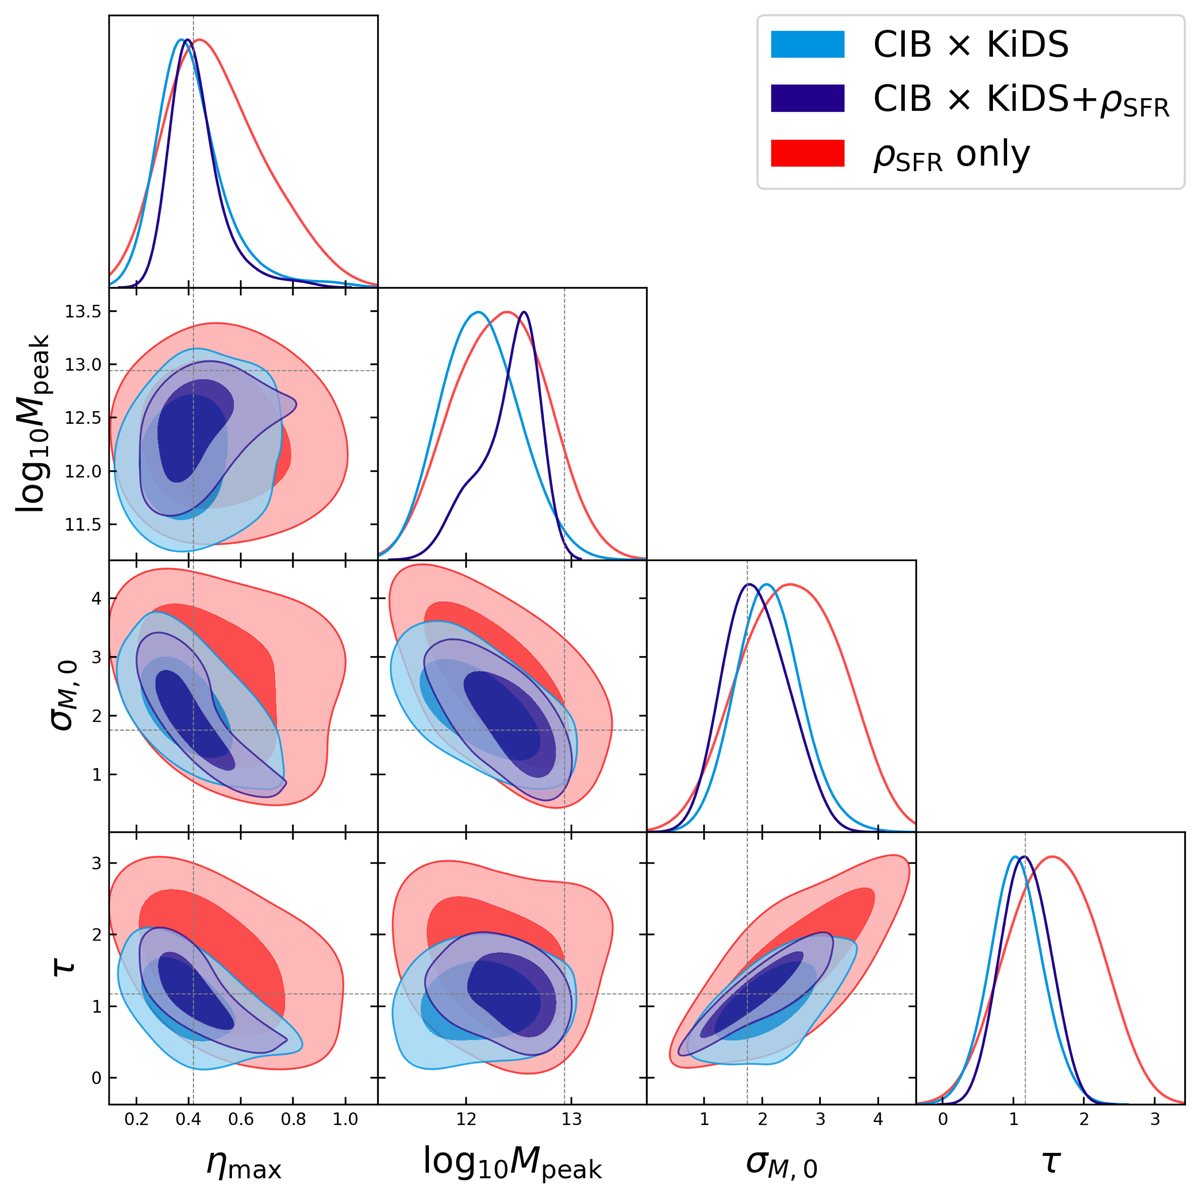
Fig. 6.
Download original image
Posterior of the SFR parameters. Contours show the 2D posteriors marginalised over all the other 25−2 = 23 parameters. The cyan contours show the constraints from the CIB-KiDS cross-correlation only, the dark blue contours show the constraints from a combination of the cross-correlation and the external SFRD data, and the red contours show the constraints from the external SFRD data only. The dark and light regions in each contour show the 68% and 95% credible regions, respectively. The dashed lines show the best-fit model from M21.
Current usage metrics show cumulative count of Article Views (full-text article views including HTML views, PDF and ePub downloads, according to the available data) and Abstracts Views on Vision4Press platform.
Data correspond to usage on the plateform after 2015. The current usage metrics is available 48-96 hours after online publication and is updated daily on week days.
Initial download of the metrics may take a while.