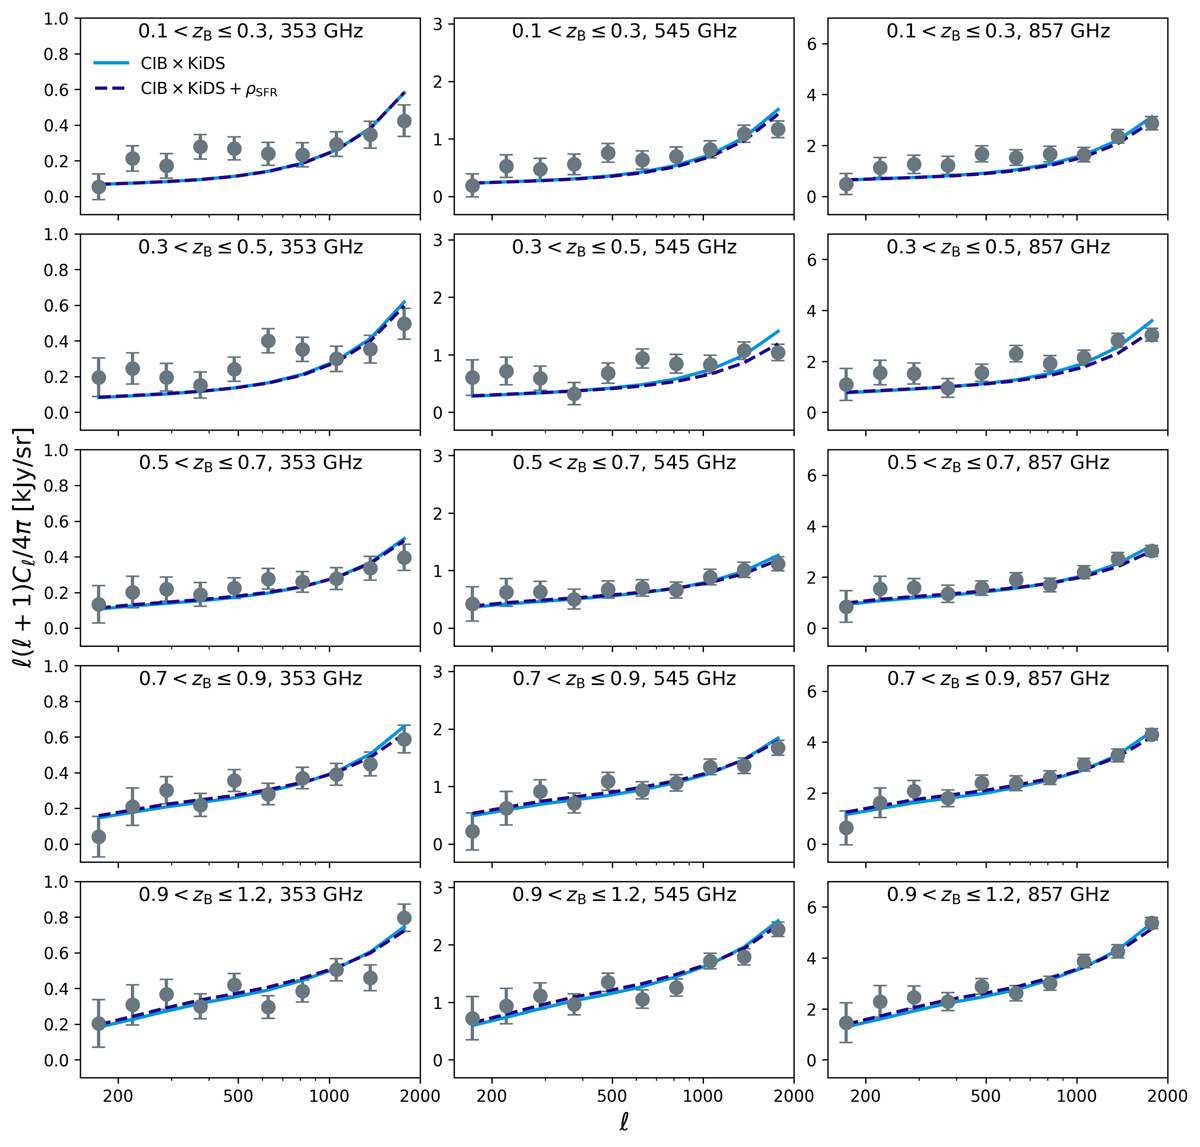
Fig. 5.
Download original image
CIB-galaxy cross-correlations with the five KiDS tomographic bins (rows) and the three CIB maps (columns). The grey points are measured from data, with standard deviation error bars calculated using the square root of the diagonal terms of the covariance matrix. The solid cyan lines show the best-fit cross-correlation signals calculated using the CIB-galaxy cross-correlation measurements alone, while the dashed blue lines show the best-fit cross-correlations when jointly fitting the CIB-galaxy cross-correlation measurements and the external SFRD.
Current usage metrics show cumulative count of Article Views (full-text article views including HTML views, PDF and ePub downloads, according to the available data) and Abstracts Views on Vision4Press platform.
Data correspond to usage on the plateform after 2015. The current usage metrics is available 48-96 hours after online publication and is updated daily on week days.
Initial download of the metrics may take a while.